
3.5. Tasks
Tasks includes Machine Task Interval Settings, Group Task Interval Settings, OEE Monitoring Settings, Tool Life Monitoring Settings, Count Monitoring Settings, Overload Monitoring Settings, Alarm Monitoring Settings, Machine Status Monitoring Settings and Task Manager Settings.
On the Tasks page, click a tab to switch between the setting groups. When you are done, click Save below the settings area, then go back to Home and click Restart Service to apply the changes.
If you are not using automatic data collection tasks, you do not need to configure Tasks.
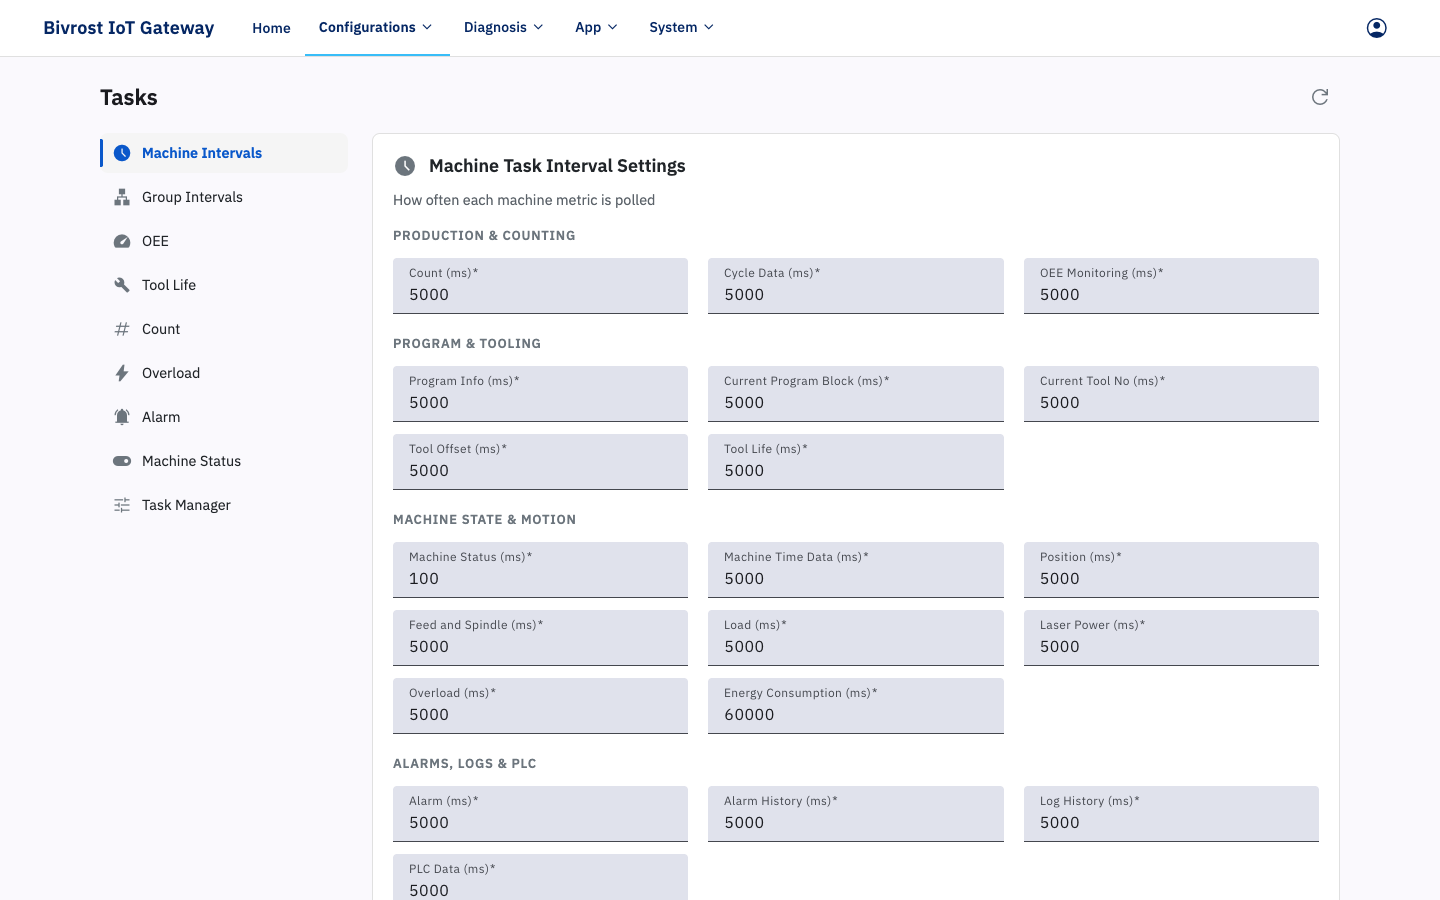
3.5.1. Machine Task Interval Settings
Section titled “3.5.1. Machine Task Interval Settings”“Machine Task Interval Settings” sets the automatic collection interval for each of the machine tasks described in 3.3.1.2. Task Settings. Intervals are in milliseconds and all default to 5000 ms.
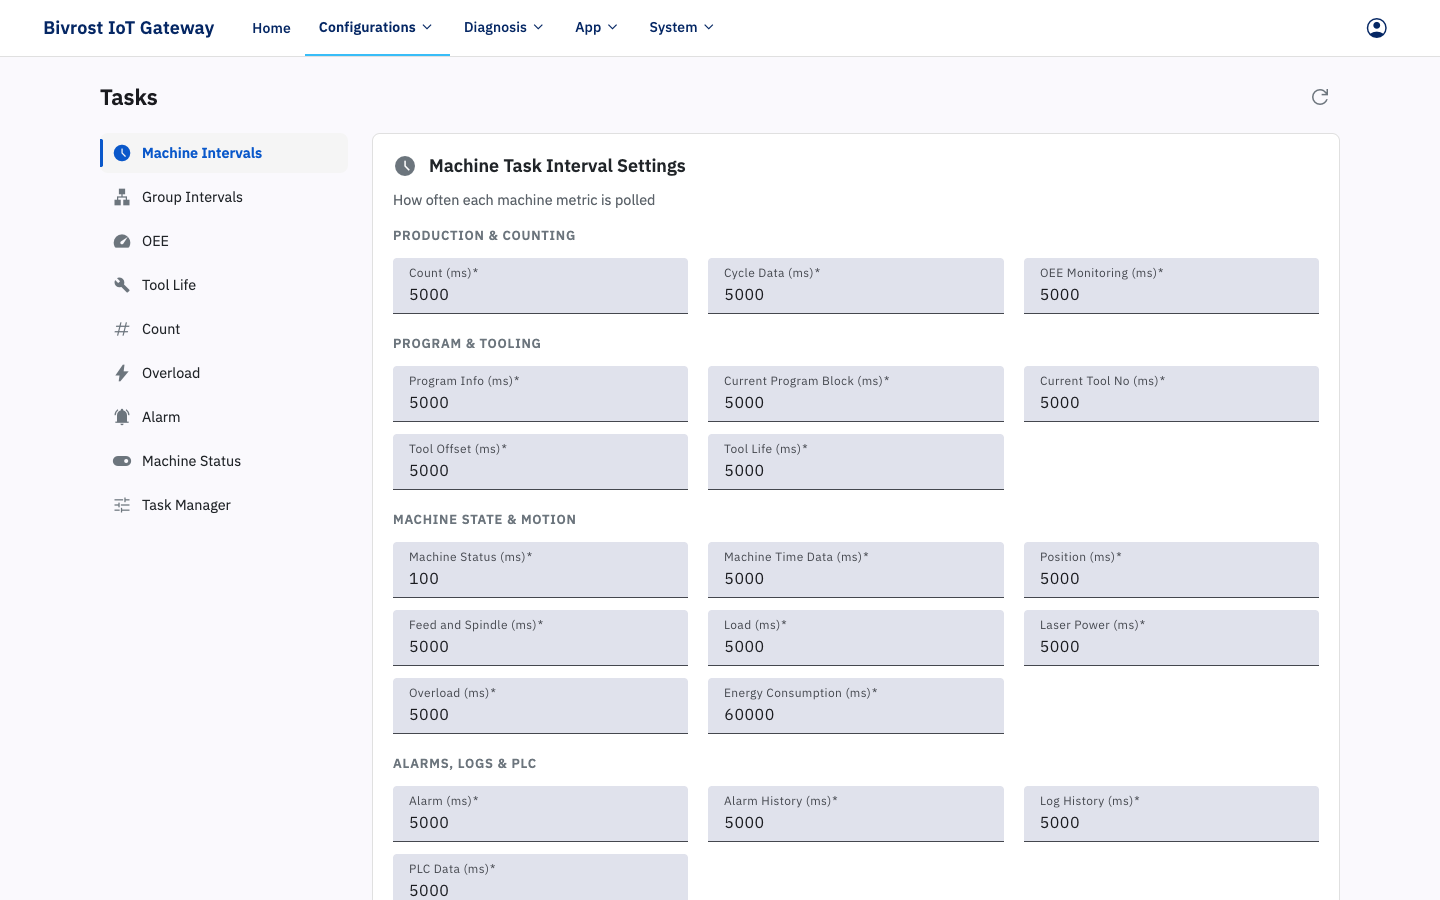
“Overload (ms)” in the screenshot above defaults to 100 ms. Overload events are very short-lived, so a short monitoring interval is needed to capture the data accurately.
“OEE Monitoring (ms)” in the screenshot above is the automatic collection interval for machine OEE data; see 11.1.1. Machine OEE Data.
When you are done, click the Save button at the bottom of the page, then click Restart Service on Home to apply the changes.
3.5.2. Group Task Interval Settings
Section titled “3.5.2. Group Task Interval Settings”“Group Task Interval Settings” sets the automatic collection interval for each of the group tasks described in 3.4.1.2. Group Task Settings. Intervals are in milliseconds and all default to 5000 ms.
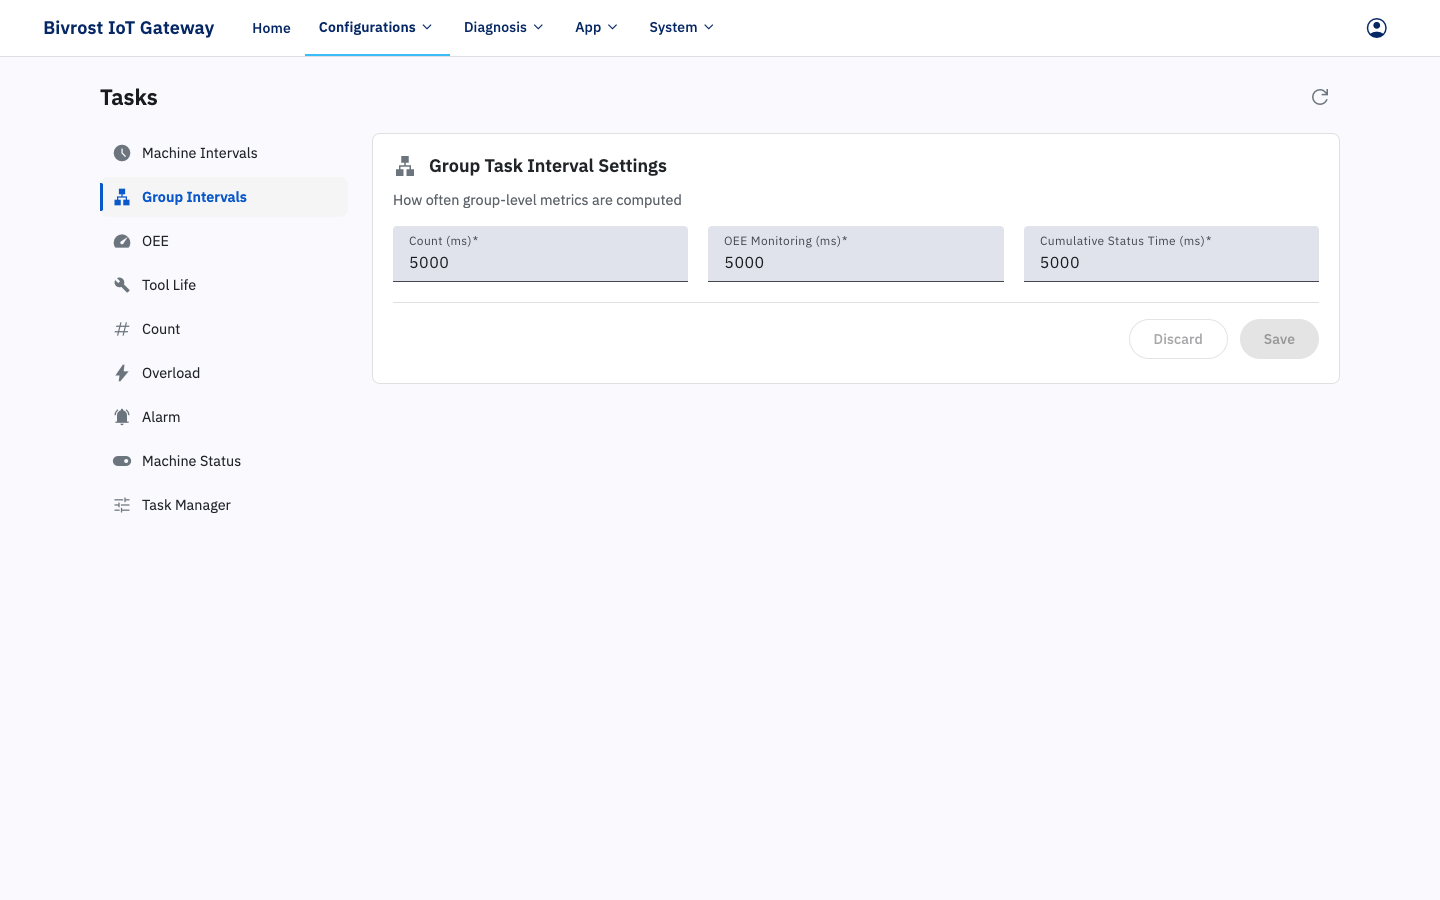
“Count (ms)” in the screenshot above is the automatic collection interval for the group part count; see 11.1.3. Group Part Count. “OEE Monitoring (ms)” is the automatic collection interval for group OEE data; see 11.1.2. Group OEE Data.
When you are done, click the Save button at the bottom of the page, then click Restart Service on Home to apply the changes.
3.5.3. OEE Monitoring Settings
Section titled “3.5.3. OEE Monitoring Settings”“OEE Monitoring Settings” defines the monitoring period and the availability formula used for machine OEE (see 11.1.1. Machine OEE Data) and group OEE (see 11.1.2. Group OEE Data).
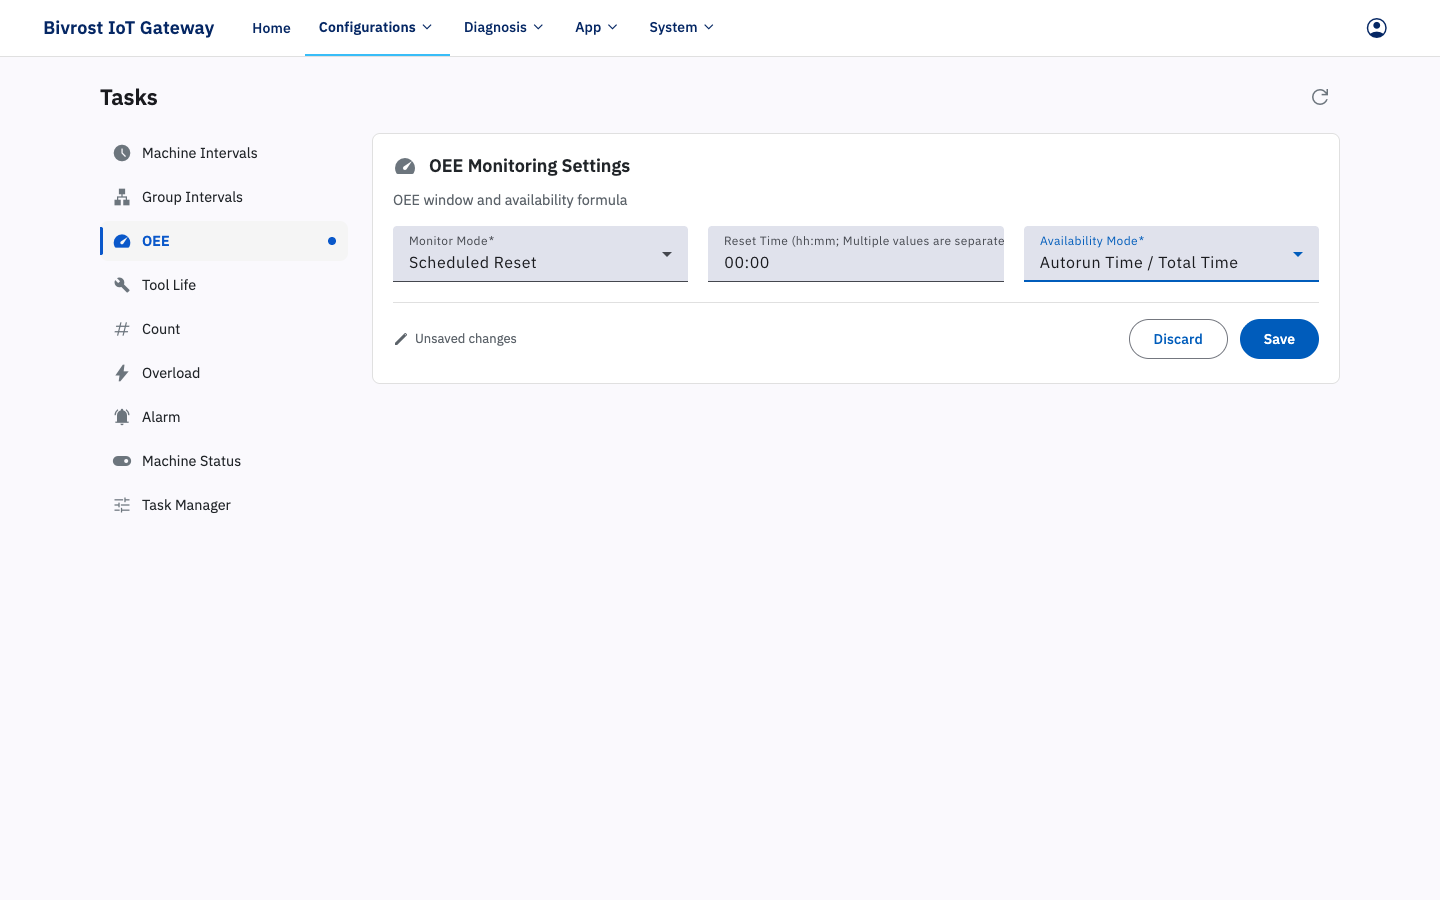
“Monitor Mode” determines how the monitoring period is defined. It offers two options: “Scheduled Reset” and “Time Window”.
Scheduled Reset: OEE statistics are calculated over the period that runs from the most recent reset time up to the present moment. “Reset Time” is the time of day at which the daily OEE statistics are reset. You can enter several reset times separated by “;”, for example 08:00;12:00;16:00;20:00;. If no reset time is entered, the default is 00:00, so OEE statistics are reset every day at 00:00.
Time Window: the window size defaults to 3600 seconds, so OEE statistics are calculated over the period that starts 3600 seconds before the present moment and ends at the present moment — that is, the last hour. A window size longer than 86400 seconds (the last day) is not recommended. If this is the first collection and the elapsed monitoring time is shorter than the window size, any time with no machine status data is treated as machine off.
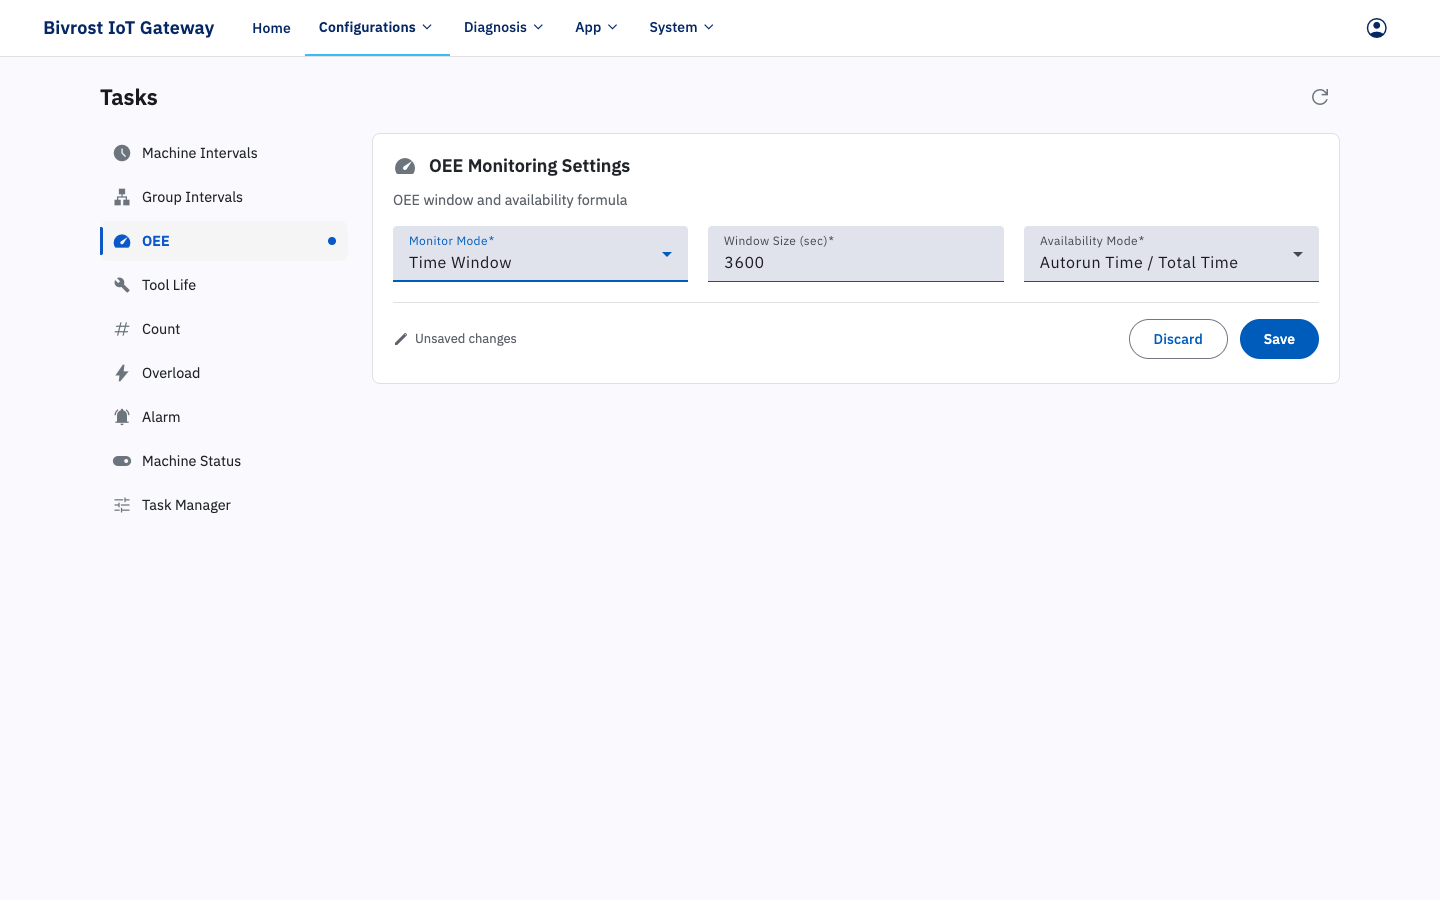
The “Availability Mode” option defaults to “Autorun Time / Total Time”, in which case:
Machine Availability = Autorun Time / Total TimeHere, autorun time is the machine’s automatic running time within the monitoring period, and total time is the monitoring period itself, as defined by “Monitor Mode”.
Group Availability = Autorun Time / Total TimeHere, autorun time is the sum of the automatic running time of every active machine in the group within the monitoring period, and total time is the total monitoring time — the monitoring period multiplied by the number of active machines in the group. The monitoring period is defined by “Monitor Mode”.
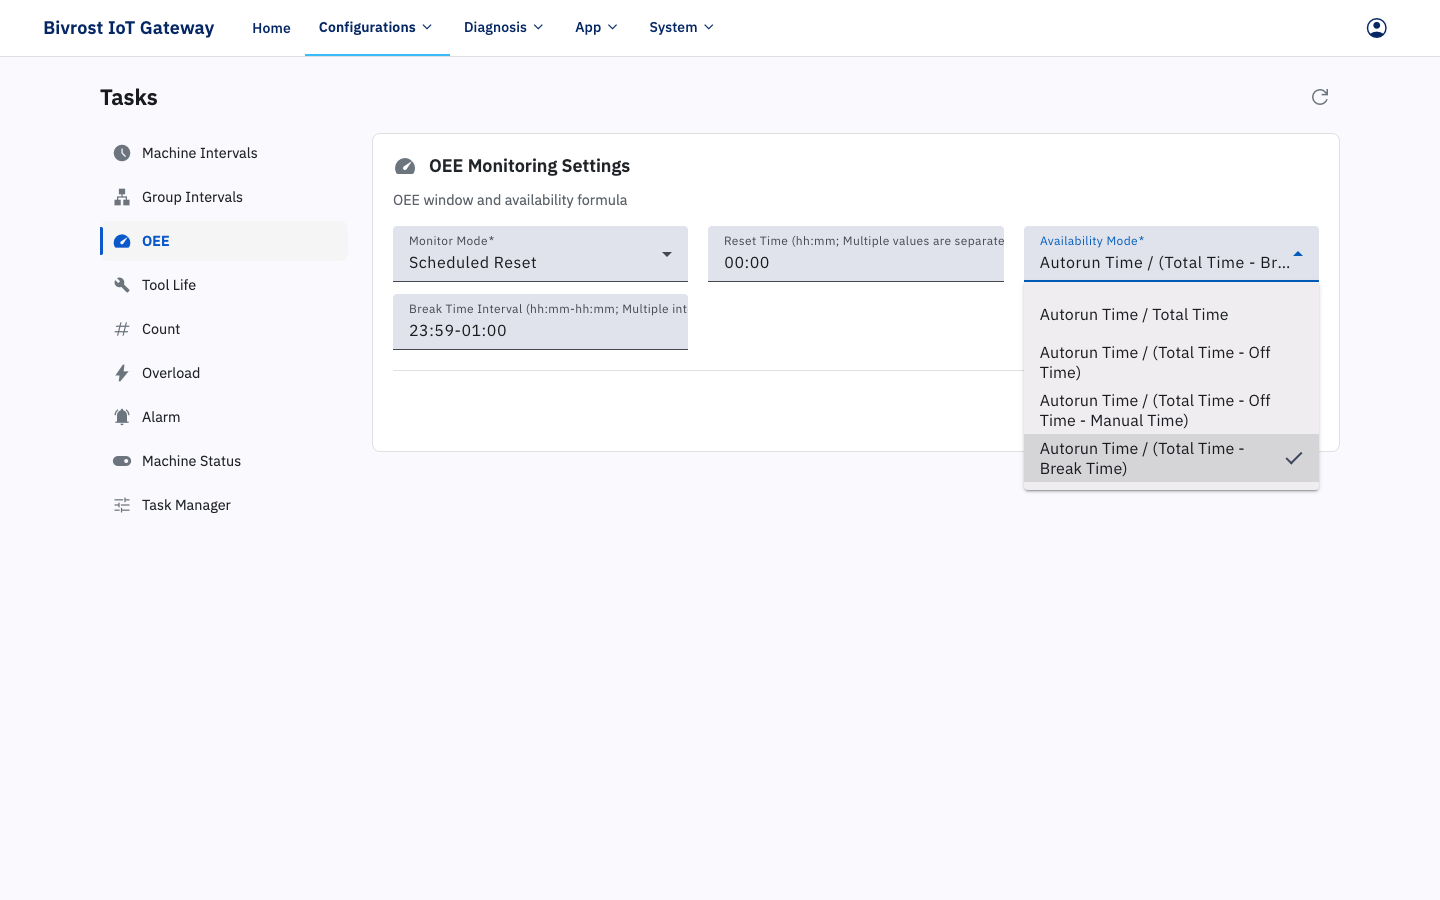
The “Availability Mode” options are:
- Autorun Time / Total Time
- Autorun Time / (Total Time - Off Time)
- Autorun Time / (Total Time - Off Time - Manual Time)
- Autorun Time / (Total Time - Break Time)
Choose whichever mode suits your needs to exclude off time, manual time or break time from the total time. Off time and manual time are derived from the machine status interface data. When you select “Autorun Time / (Total Time - Break Time)”, you can define the break time intervals, as shown below:
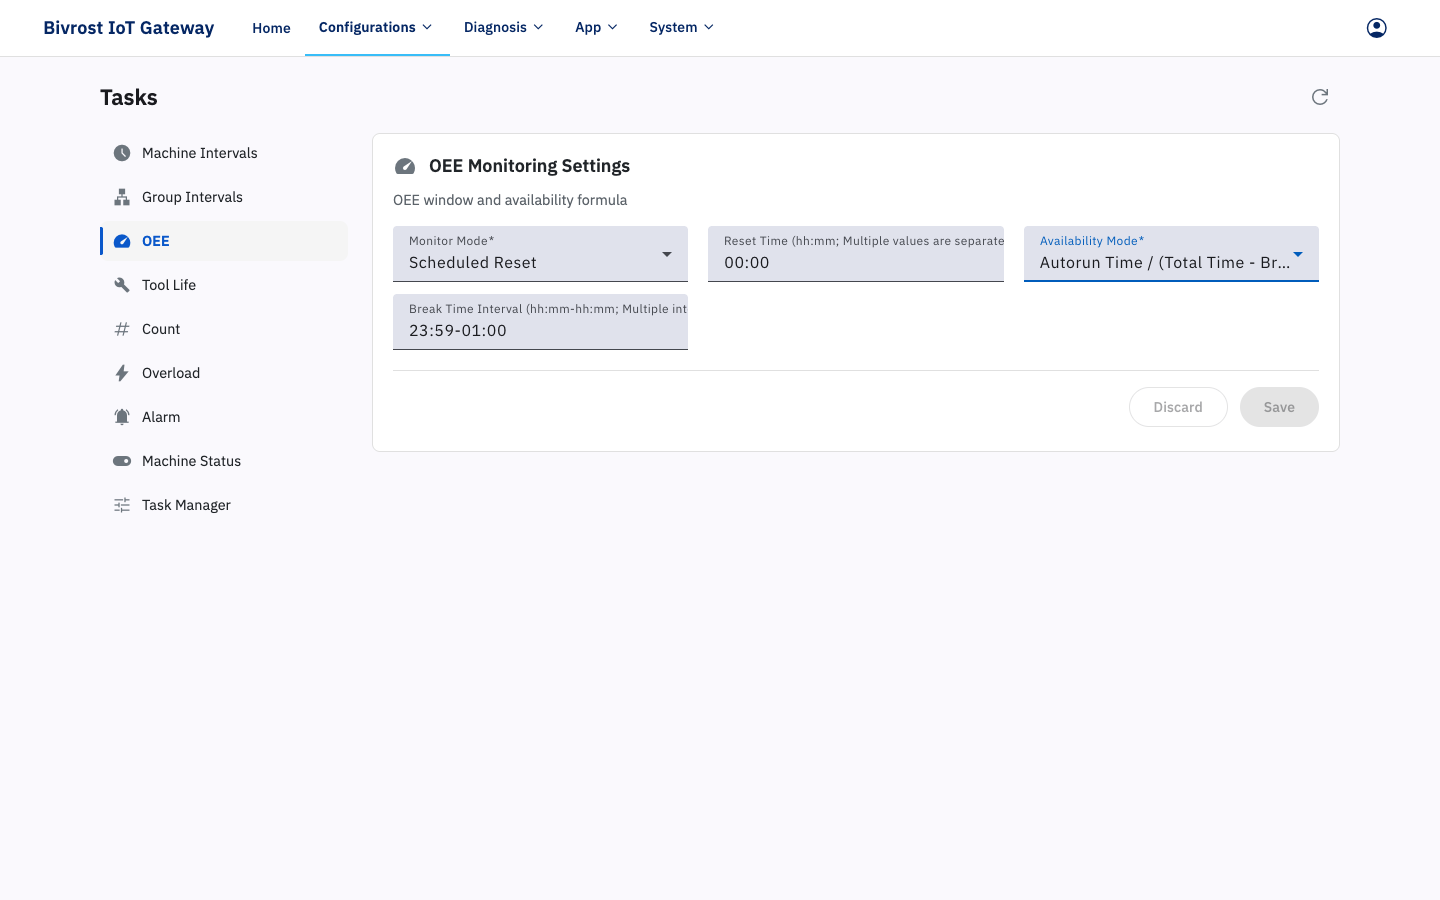
Suppose the break time intervals are set to 07:30-08:00;19:30-20:00; and the current time is 19:45. With the settings above:
- Total time = 3600 seconds; the monitoring period runs from 18:45 to 19:45 and overlaps part of a break interval.
- Break time = 19:45 - 19:30 = 15 minutes = 900 seconds.
3.5.4. Tool Life Monitoring Settings
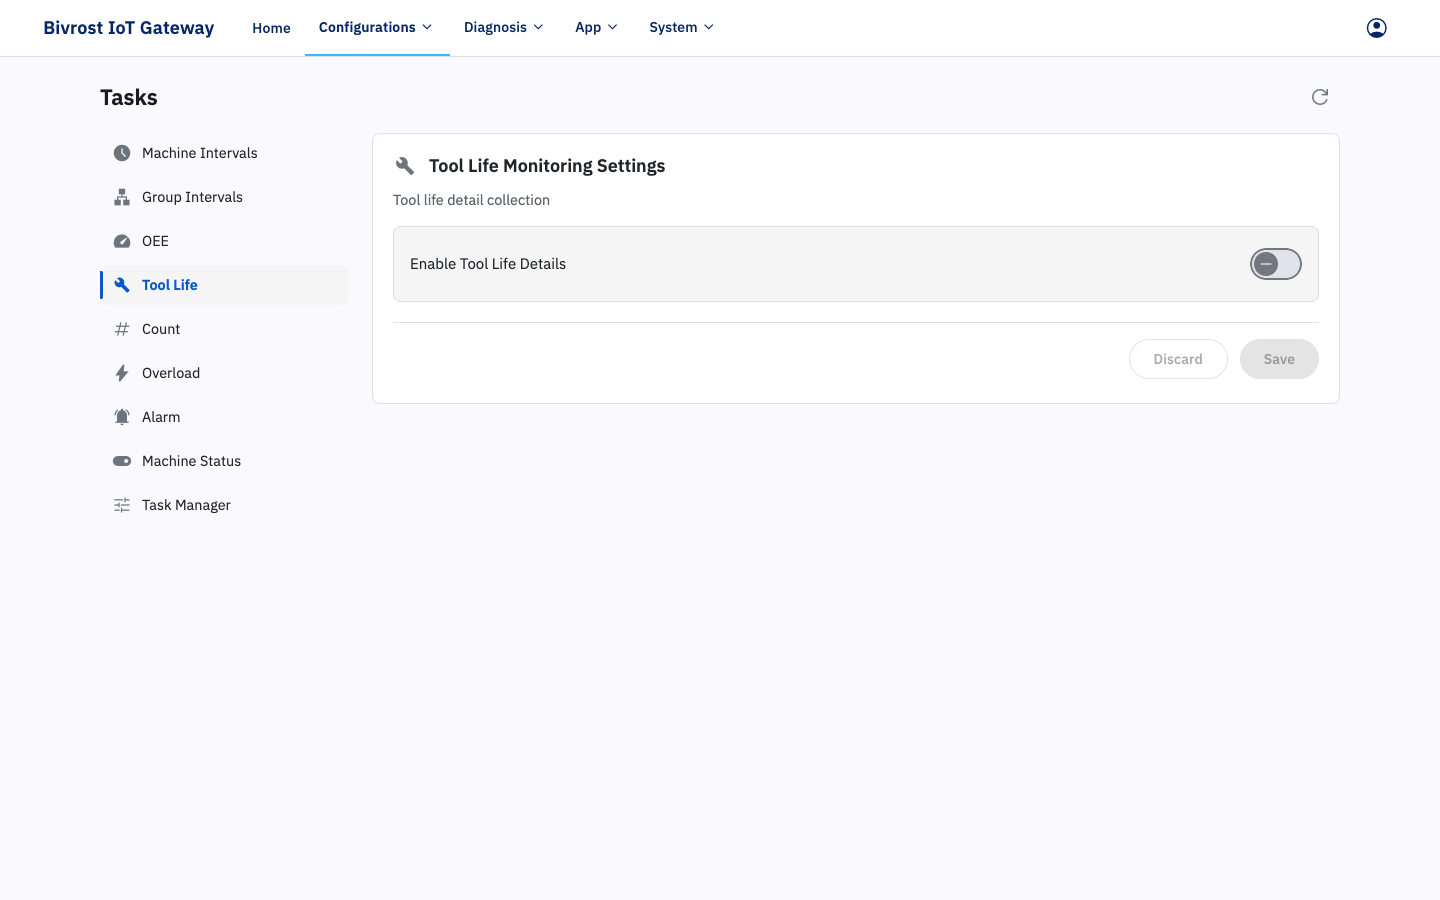
Section titled “3.5.4. Tool Life Monitoring Settings”“Tool Life Monitoring Settings” configures the tool life data. The “Enable Tool Life Details” option is off by default, in which case the tool life interface returns only normalized data — values converted from the raw data and calculated using a single common definition and unit. With the option enabled, the tool life interface returns both the normalized data and the raw data. For a description of the normalized and raw tool life data, see 4.2.25. ToolLife: Tool Life Data.
3.5.5. Count Monitoring Settings
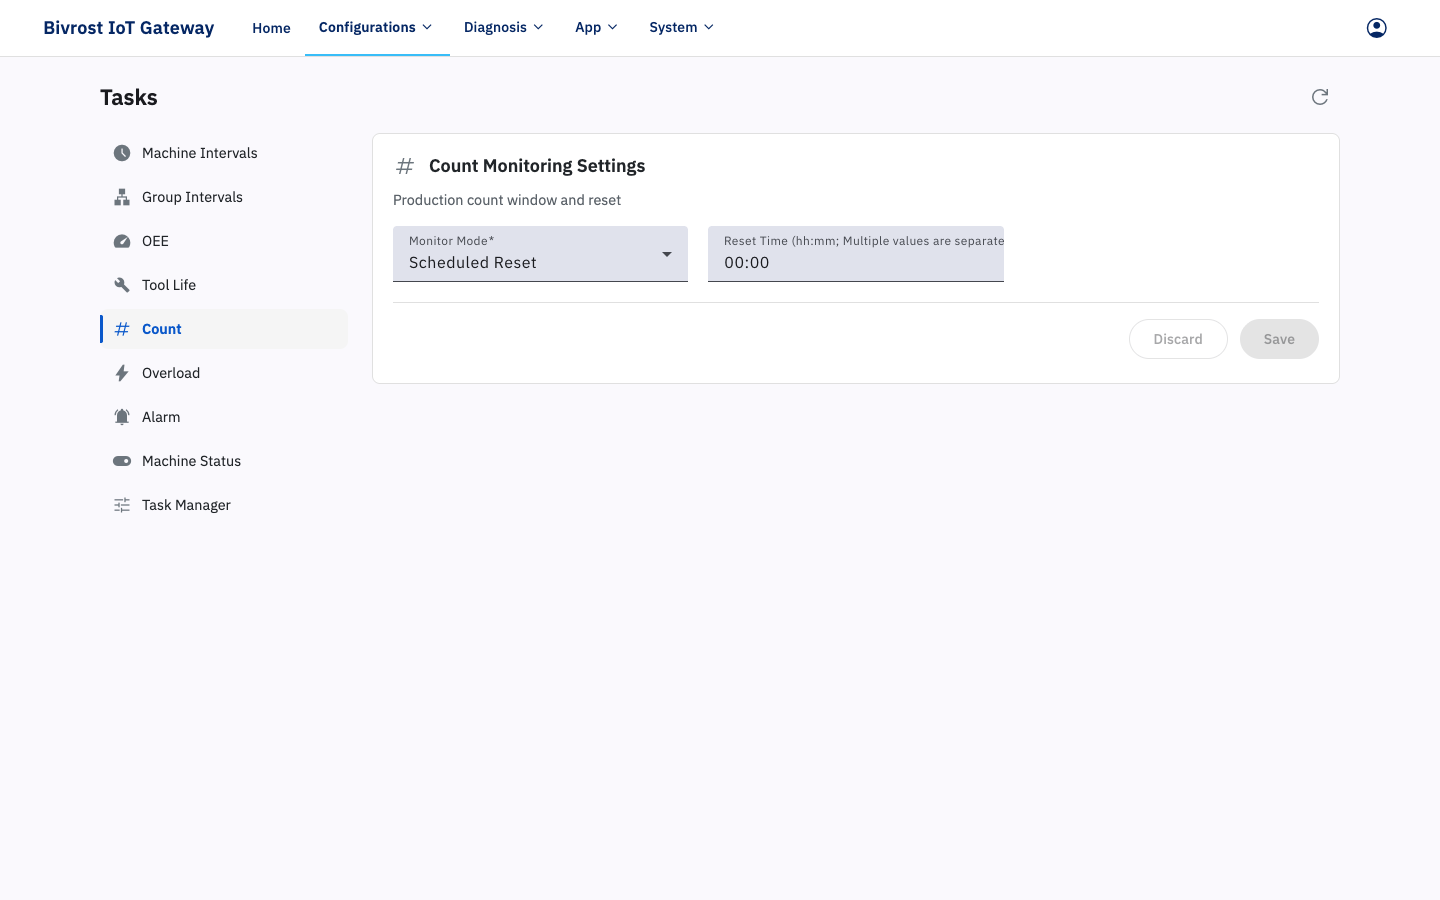
Section titled “3.5.5. Count Monitoring Settings”“Count Monitoring Settings” defines the monitoring period for the current part count.
The current part count is the machine’s cumulative part count within the monitoring period.
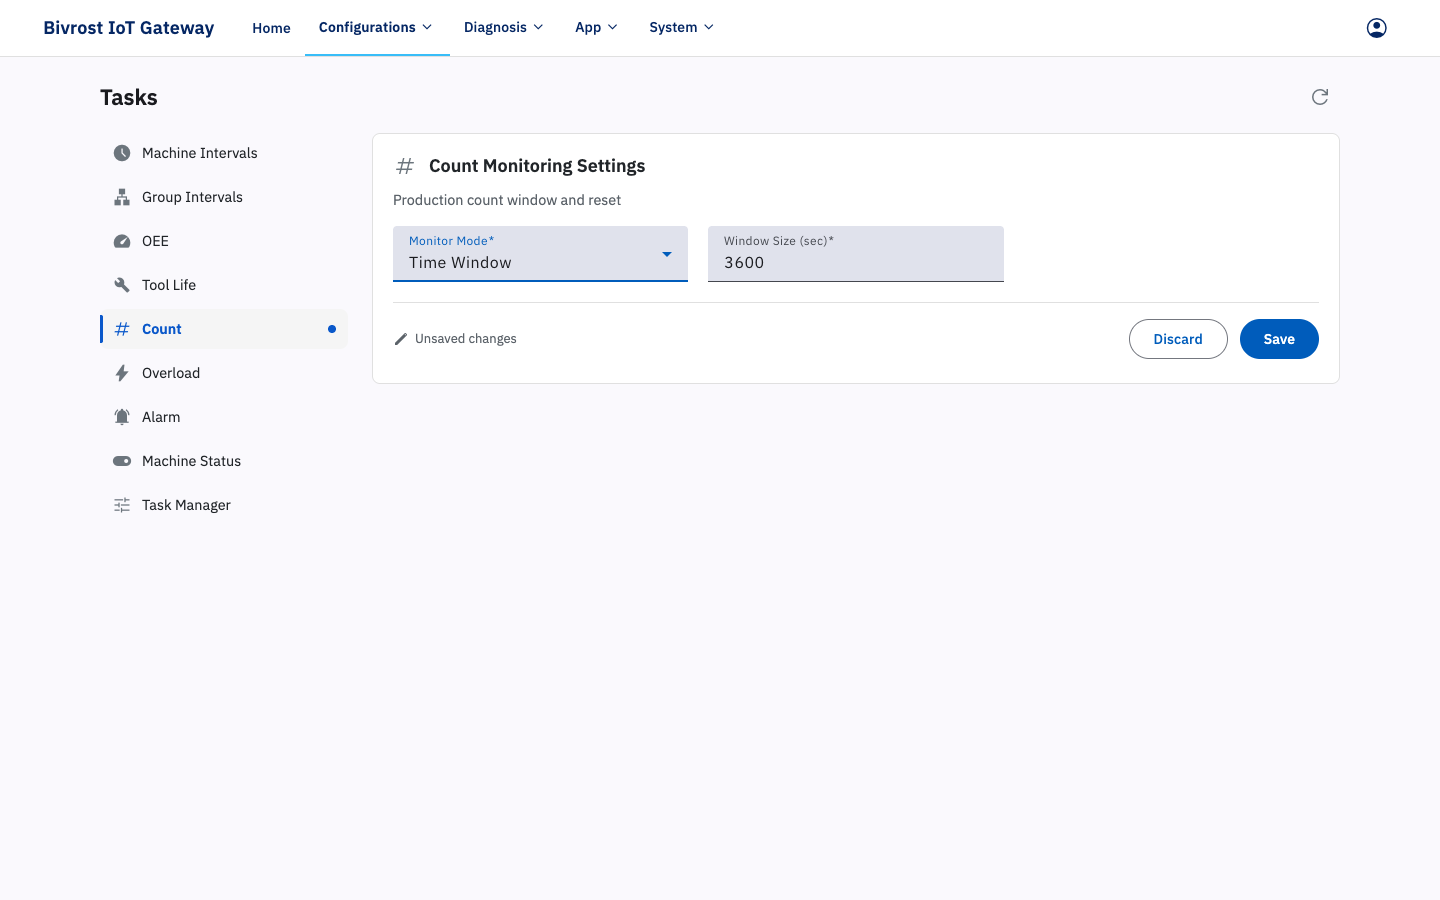
“Monitor Mode” offers “Scheduled Reset” and “Time Window”; the default is “Scheduled Reset” with a default reset time of 00:00. For a description of the two modes, see 3.5.3. OEE Monitoring Settings.
3.5.6. Overload Monitoring Settings
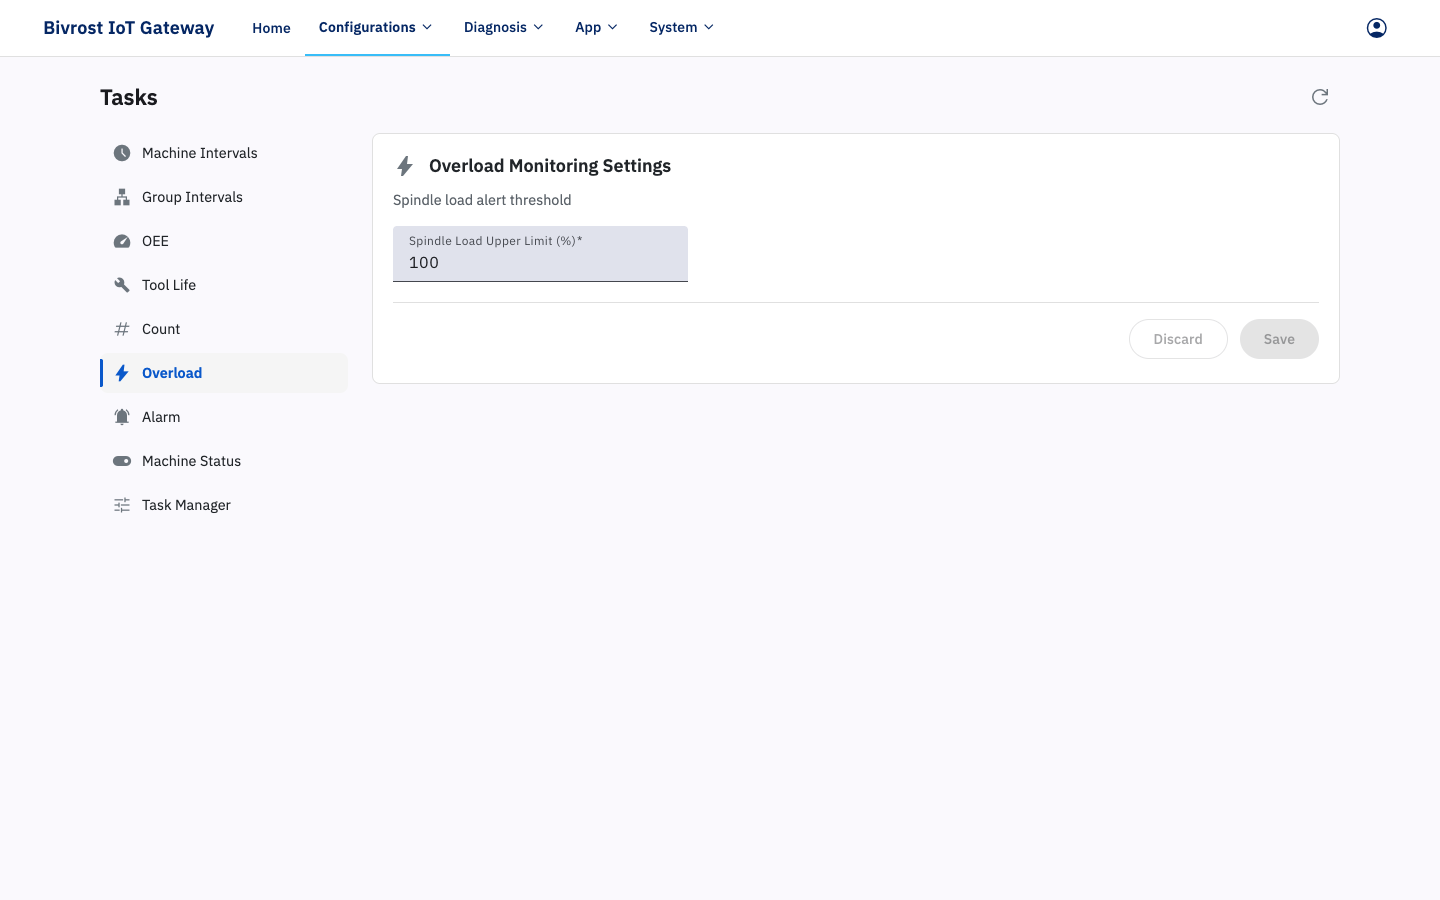
Section titled “3.5.6. Overload Monitoring Settings”“Overload Monitoring Settings” sets the spindle load upper limit used by the overload task. The default is 100%.
Overload monitoring records the total time the spindle load stays above the limit.
3.5.7. Alarm Monitoring Settings
Section titled “3.5.7. Alarm Monitoring Settings”“Alarm Monitoring Settings” classifies the alarm messages returned by the alarm task into alarm levels and sets the minimum alarm level at which a machine is considered to be in an active alarm state.
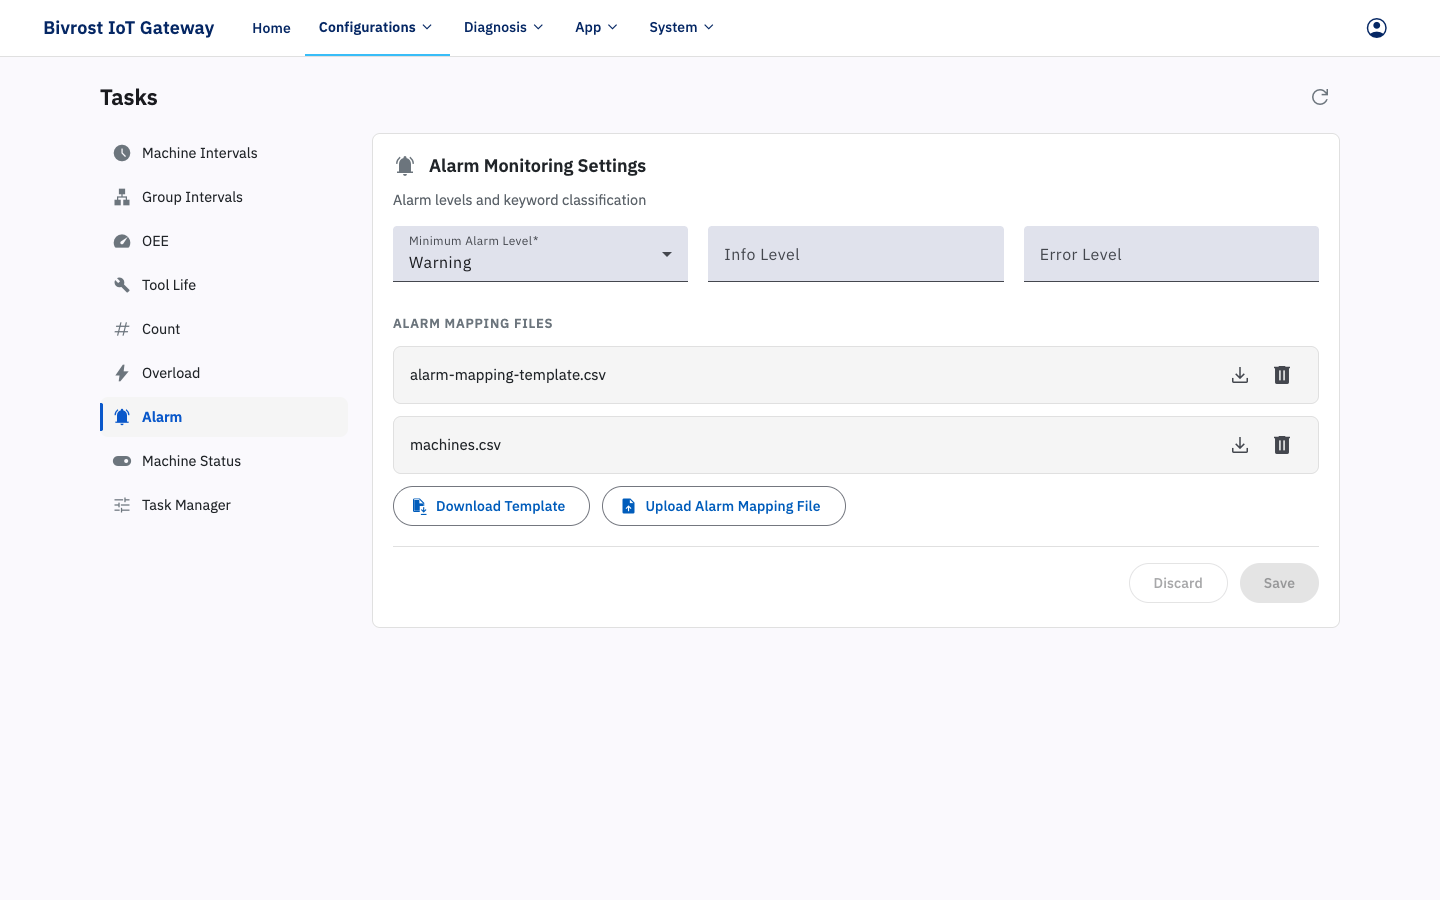
Three alarm levels are currently supported, in descending order of priority: Error (ERR), Warning (WRN) and Information (INF). If the minimum alarm level is set to Warning, the gateway automatically ignores information-level alarms and records only error- and warning-level alarms, and uses those two levels to decide whether the machine is in an active alarm state.
In the “Info Level” and “Error Level” input boxes you can enter alarm keywords, separating multiple entries with “;”. Any alarm containing one of those keywords is assigned to the corresponding level.
If no error-level keyword is found in an alarm, the alarm defaults to warning level.
By default, the minimum alarm level for treating a machine as being in an active alarm state is warning level.
3.5.7.1. Alarm Mapping Files
Section titled “3.5.7.1. Alarm Mapping Files”Alarm Mapping maps the alarm numbers reported by a machine to your own alarm messages. It is useful for machines that report only an alarm number and no alarm text, or when alarm descriptions need to be standardized.
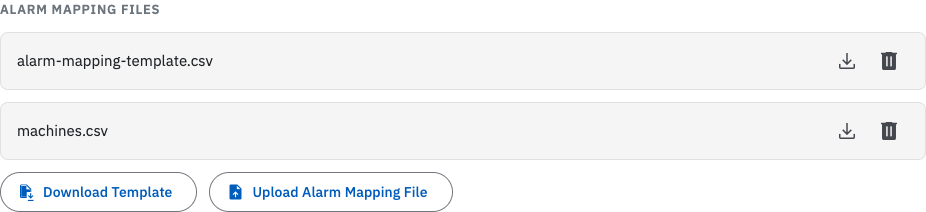
Use the “Alarm Mapping Files” area below “Alarm Monitoring Settings” to upload and manage mapping files:
- Click Upload Alarm Mapping File and select a local CSV file. Only non-empty CSV files are supported. The uploaded file then appears in the list.
- Each file in the list has a download and a delete button on the right.
- Click Download Template to get a sample CSV template (
alarm-mapping-template.csv). - When no file has been uploaded, the area shows “No alarm mapping files uploaded.”
An alarm mapping file is a CSV file with two columns, headed “AlarmNo” and “Content”, for example:
| AlarmNo | Content |
|---|---|
| 1000 | Emergency stop pressed |
| 2001 | Spindle overload |
After uploading a mapping file, go to Machines, open the “Alarm” task settings of the machine concerned, enable alarm mapping and select the file; see 3.3.1.2.6. Alarm Mapping.
3.5.8. Machine Status Monitoring Settings
Section titled “3.5.8. Machine Status Monitoring Settings”“Machine Status Monitoring Settings” configures the options of the machine status task, including Enable Status Details, Enable Adjusted Manual Status and Enable Status Conversion. For the machine task variables referred to in this section, see 4.2.4. CNCStatus: Machine Status.
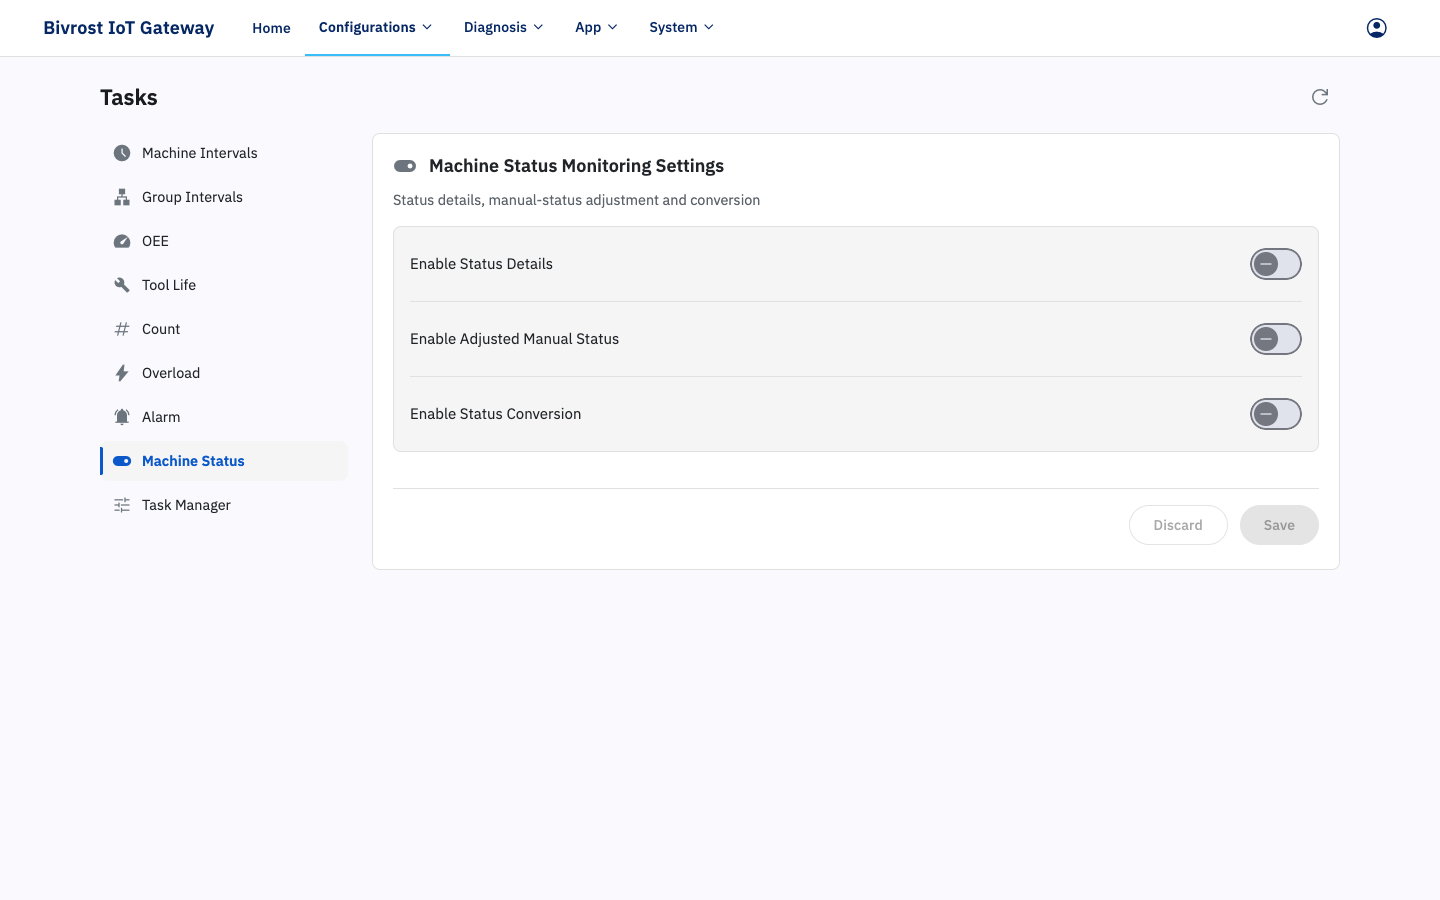
The “Enable Status Details” option is off by default, in which case the uploaded status data contains no status details. With the option enabled, the uploaded data includes the status details.
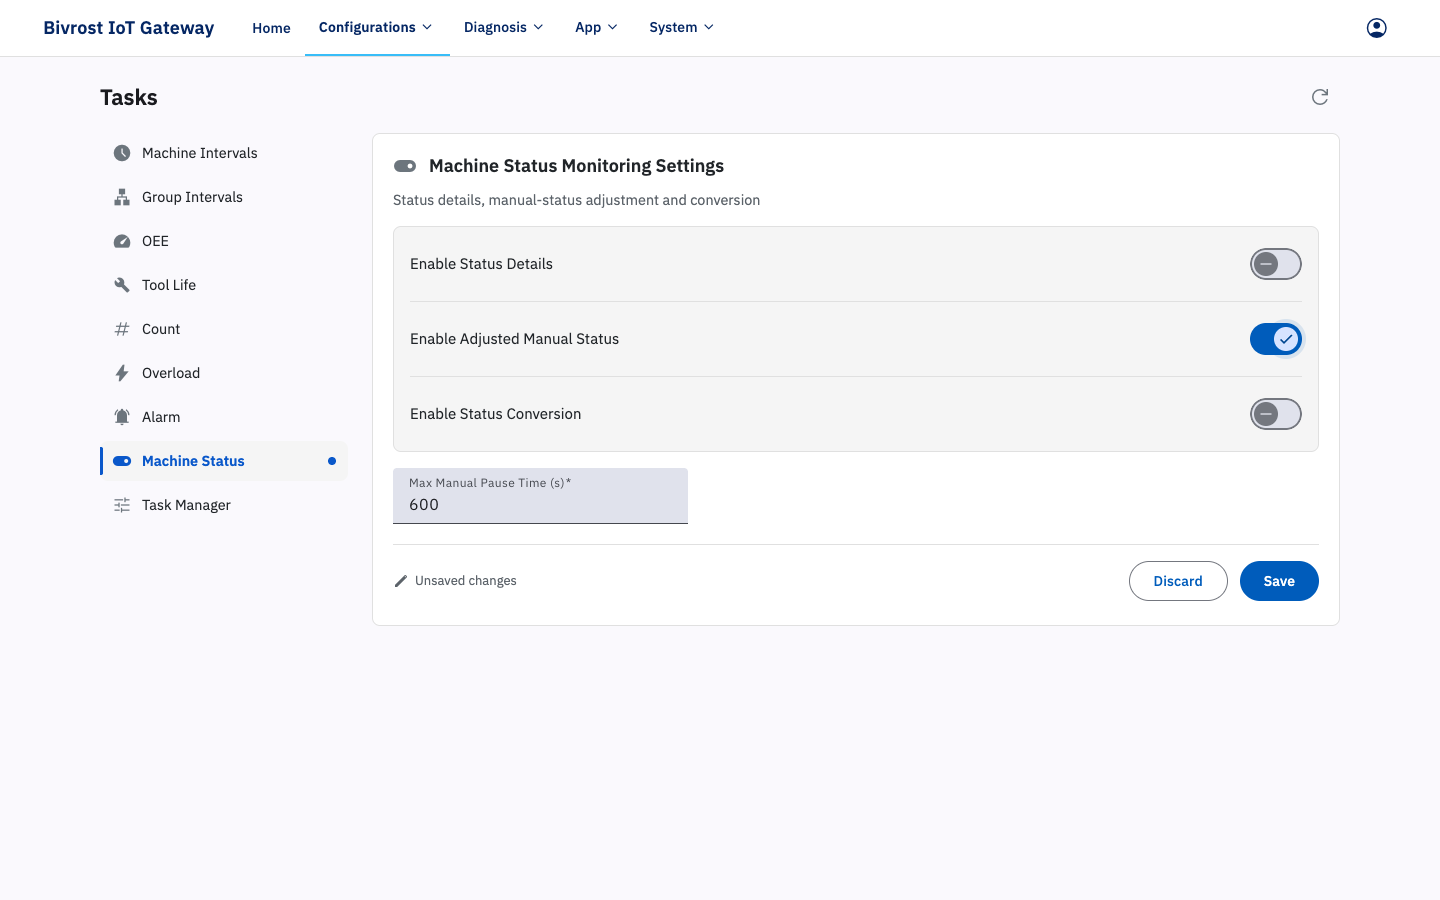
When “Adjusted Manual Status” or “Status Conversion” is enabled, the status is adjusted according to the corresponding rules and reported in adjustedStatus (4.2.4. CNCStatus: Machine Status). Wherever machine status is involved — OEE statistics, cumulative status time and so on — the adjusted status takes precedence. Both options are off by default, in which case adjustedStatus is identical to the real-time status returned by the machine. “Adjusted Manual Status” and “Status Conversion” here are global settings. Enabling the machine-level settings of the same name in 3.3.1.2.5. Special Settings overrides the global settings.
The rules for adjusting the manual status are:
- The machine is currently in the Manual state;
- The time since the machine changed from a non-Manual state to the Manual state exceeds the configured Max Manual Pause Time;
- The machine’s coordinate data has remained unchanged for longer than the configured Max Manual Pause Time.
Normally adjustedStatus is identical to the machine’s real-time status. If all of the above conditions are met at the same time, adjustedStatus is no longer Manual but is corrected to Wait.
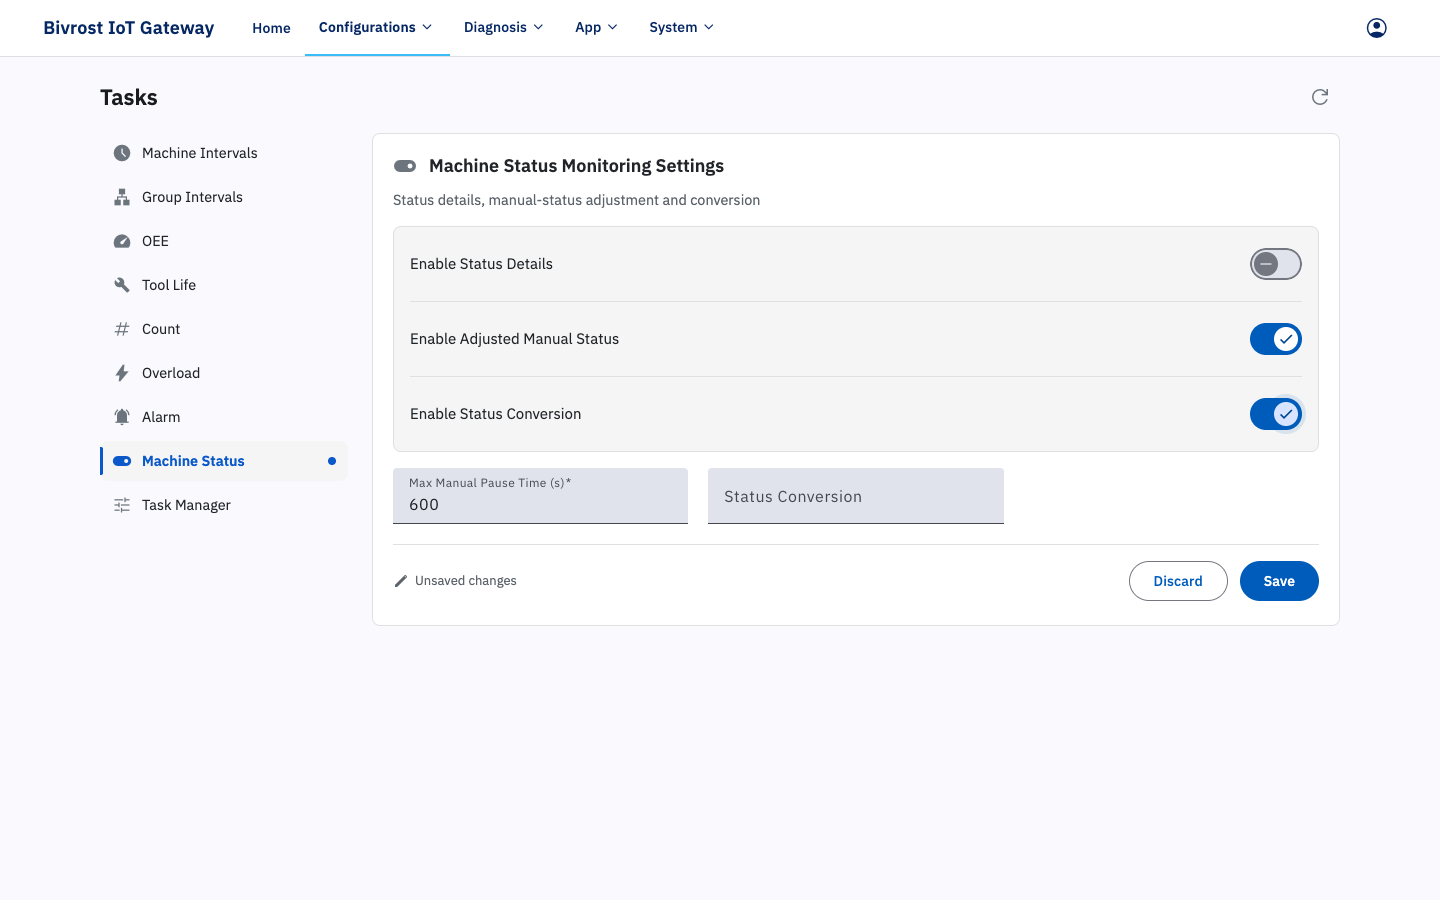
With status conversion enabled, adjustedStatus is set according to the commands you enter, for example:
CNCStatus_cncStatus = "MANUAL_MDI_RUN" | AUTO_RUNCNCStatus_cncStatus = "MANUAL_MDI_RUN" is the precondition (see 11.2.2. Precondition): if the cncStatus (running status, of type String) returned by this machine status task is “MANUAL_MDI_RUN”, then adjustedStatus is set to AUTO_RUN. Separate multiple conversion commands with “;”.
When both options are enabled, the manual status adjustment runs first and the status conversion second.
3.5.9. Task Manager Settings
Section titled “3.5.9. Task Manager Settings”Each task manager corresponds to one task thread. “Task Manager Settings” sets the maximum number of task managers, that is, the maximum number of task threads.
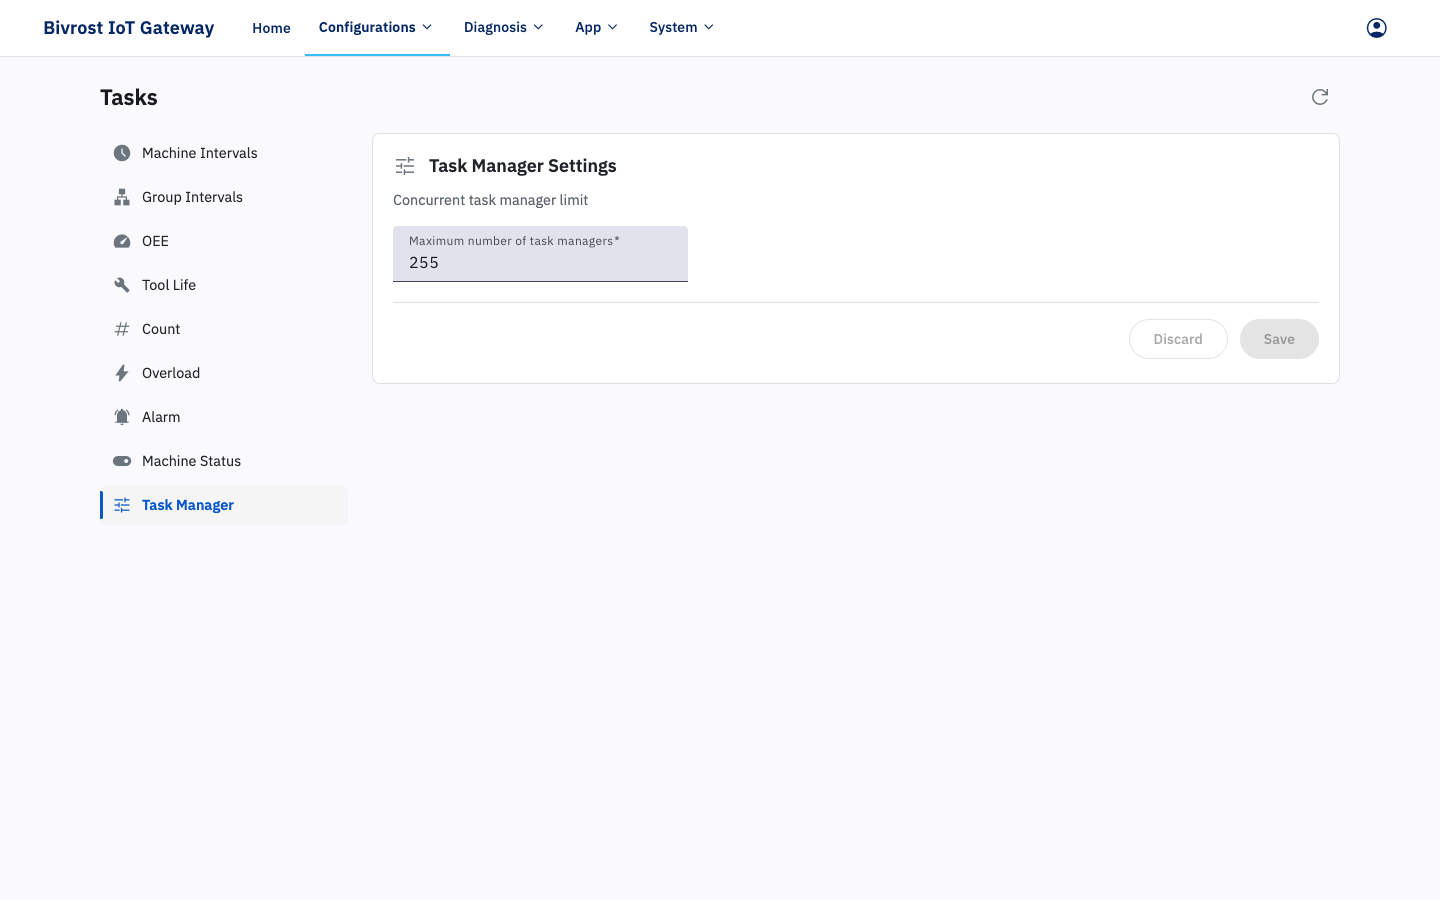
Each machine is allocated one task manager by default. You can assign several independent task managers to improve task throughput (see Parallel Task Processing in 3.3.1.5. Advanced Settings). The more task managers there are, the greater the demands on the hardware, so tune this parameter to your hardware’s capabilities. The maximum number of task managers defaults to 255. When the total number of task managers required by the active machines exceeds this maximum, task managers are merged automatically to bring the total back below the limit, which reduces task throughput.