3.11. Monitor
The Monitor page shows machine and group status in real time. At the top of the page are device counts summarised by status (Device Total, Run, Manual, Wait, Emergency, Off, Alarm), each of which can be clicked to filter. Below it are the Machine List (Machine Name, System, Status, Alarm Status) and the Group List.
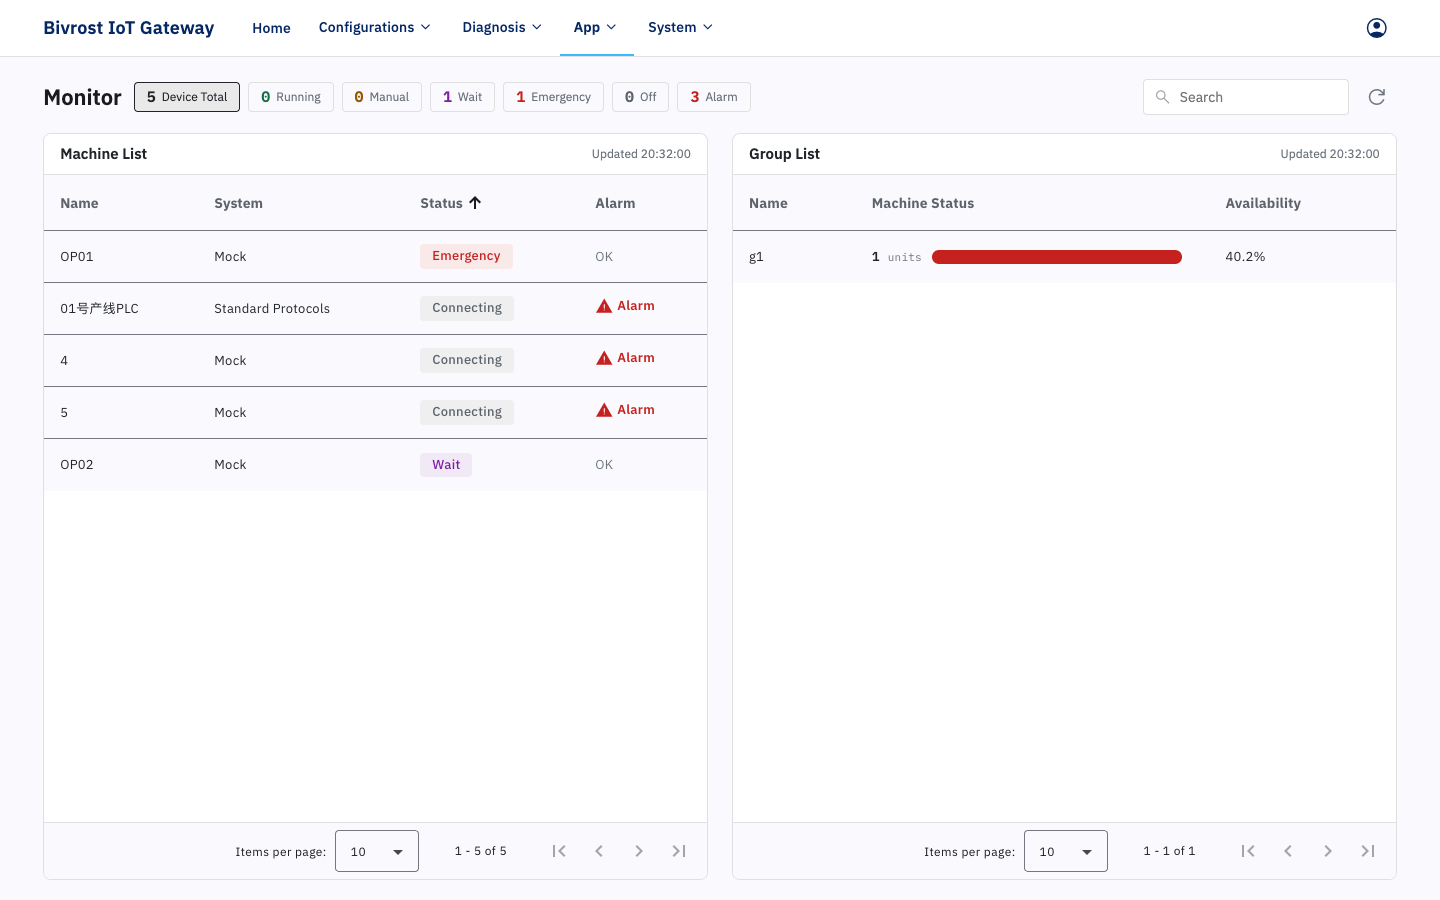
The layout adapts to the screen size: the Machine List and the Group List may be arranged side by side instead of one above the other.
3.11.1. Machine Monitor
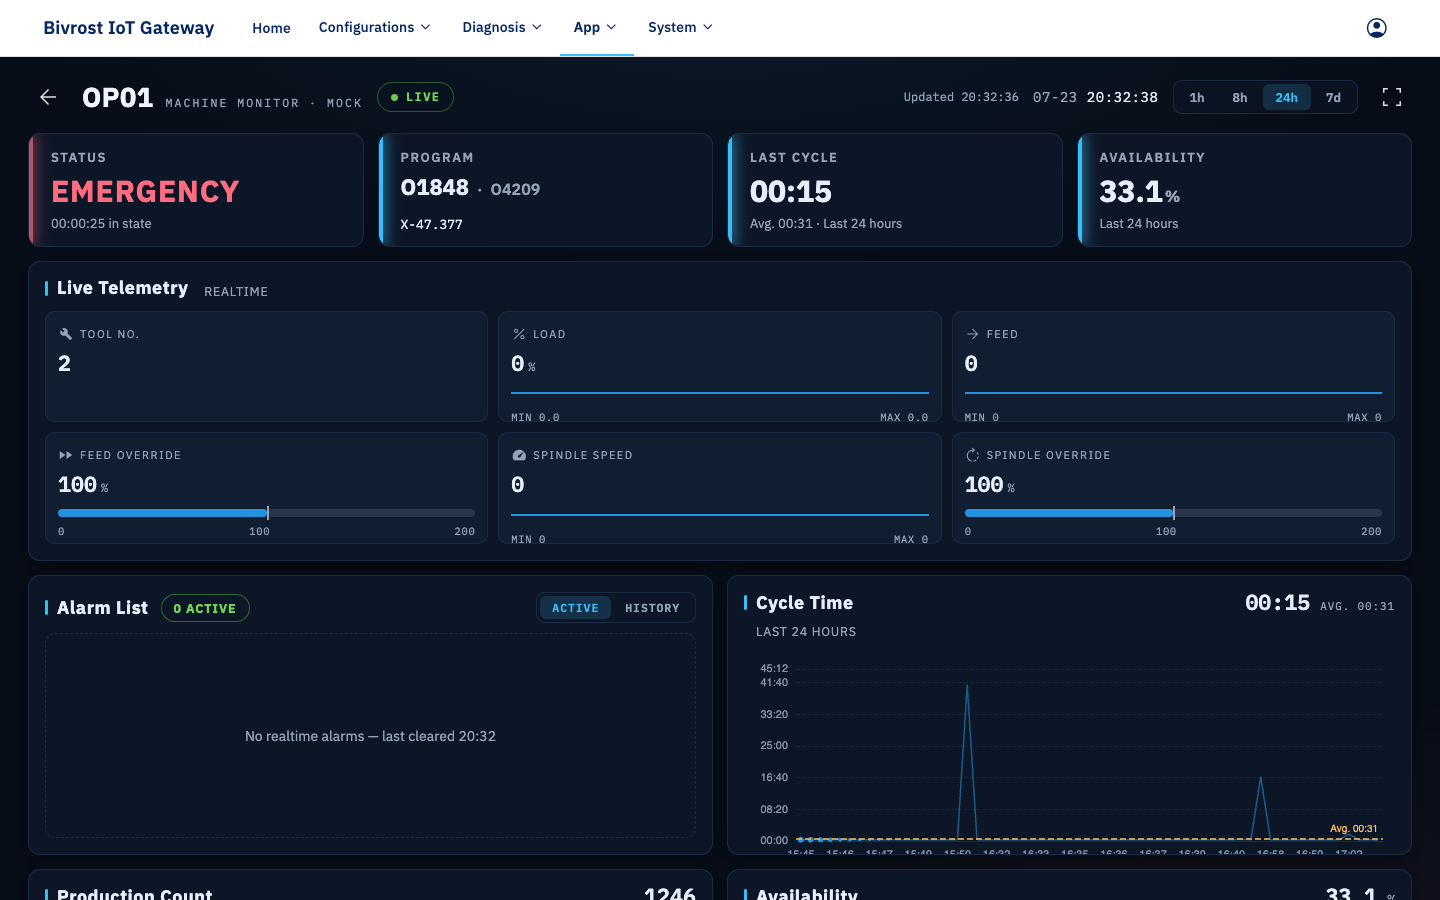
Section titled “3.11.1. Machine Monitor”Click a machine row in the Machine List to open the Machine Monitor page, which shows the machine’s live data (Main Program, Sub-program, current Alarm Level, Current Tool No, spindle load, feedrate, Feedrate Override, spindle speed, Spindle Override and so on) together with the Count, Availability, status statistics and Alarm History for the last 24 hours.
The large number to the right of the Production Count card’s title is the Current Count, the live count for the current counting period; the caption beneath it reads “Current Count”, followed by the total for the selected time range. The period mode (Scheduled Reset or Time Window) and its reset times come from 3.5.5. Count Monitoring Settings; the page no longer repeats them.
The ‹ button in the top-left corner returns to the Monitor home page.
3.11.2. Group Monitor (Group Overview)
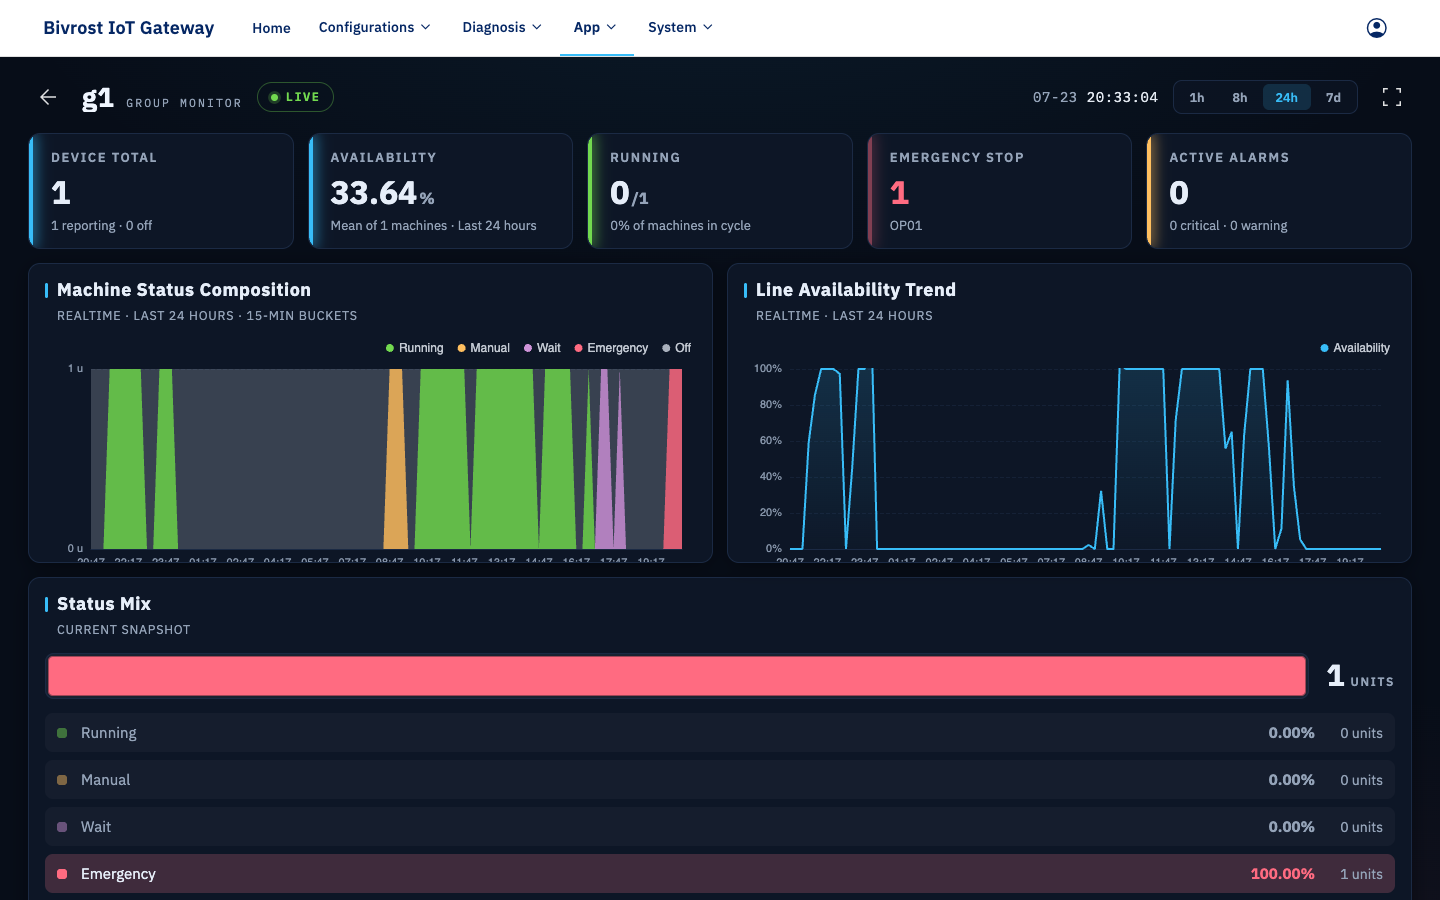
Section titled “3.11.2. Group Monitor (Group Overview)”Click a group row in the Group List to open the Group Monitor page, which presents the group’s live data as an Andon wall (Availability, the number of machines in each status, a status card for every machine, alarm severity and time, and so on) along with the availability and status trend charts. For groups with a large amount of data, the trend charts take a moment to load.
The ‹ button in the top-left corner returns to the Monitor home page.