
3.10. Analysis
The Analysis page extracts the machine and group data held in the gateway’s local storage and builds a statistics table for a given group, over a given period of time, broken down by grouping interval.
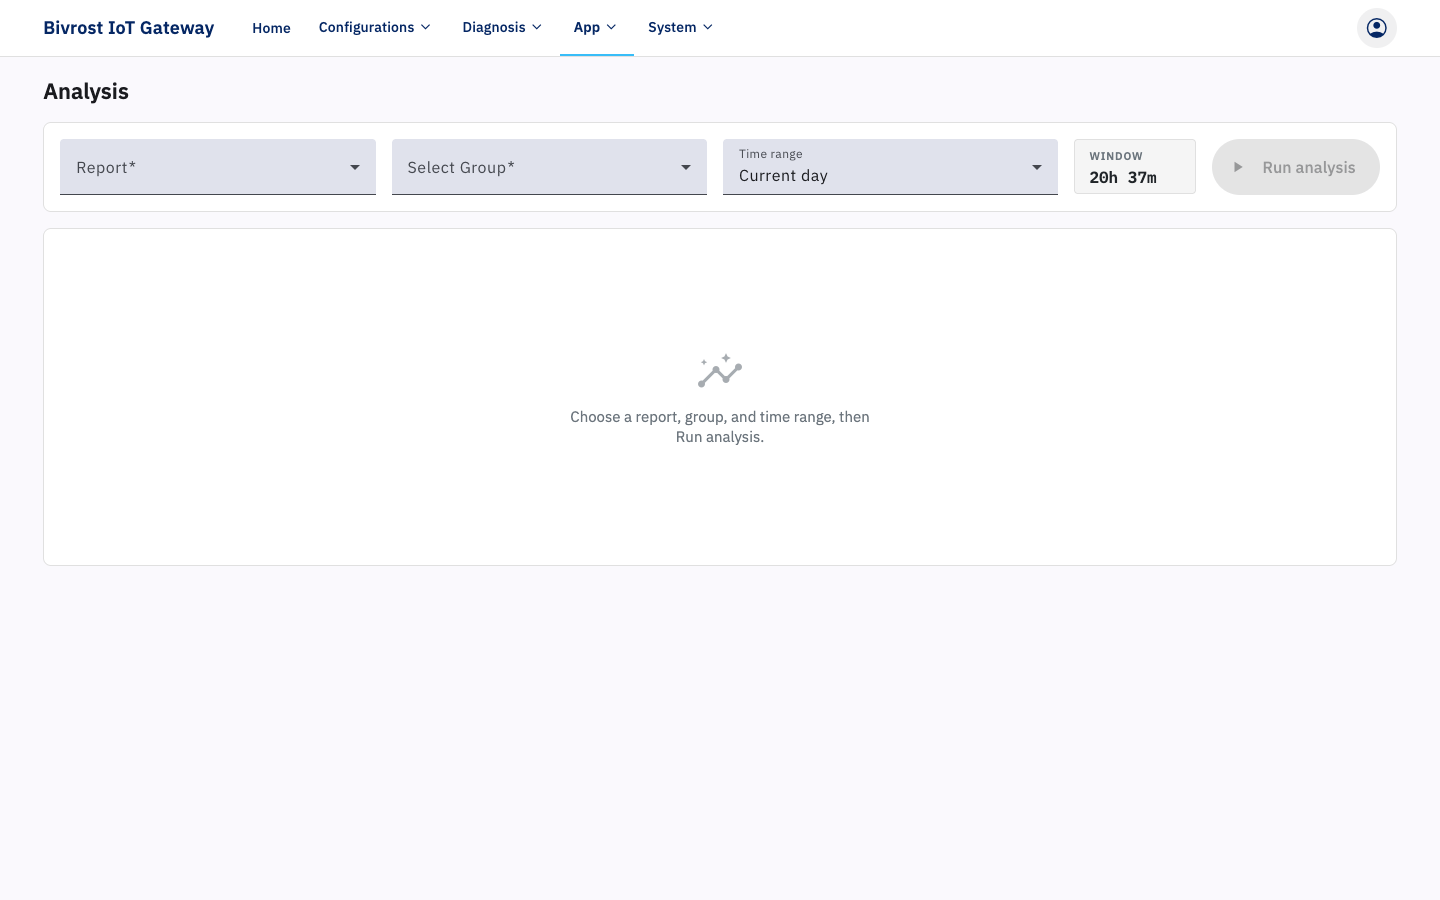
To run an analysis, select an analyzer, select a group, set the time range, and click Run analysis to get the result.
- Analyzer options: Alarm Analysis, Count Analysis, Cycle Analysis, OEE Analysis, Overall Analysis, and so on.
- Group options: the groups activated on the Groups page.
Once the analyzer and the group are selected, the Time range list offers three ways to set the period.
Rolling window (ends now): a period that ends at the current time, chosen from preset lengths such as 5m, 1h, 1d and 30d. Choosing 30d, for example, runs the analysis from 30 days before the current time up to the current time.
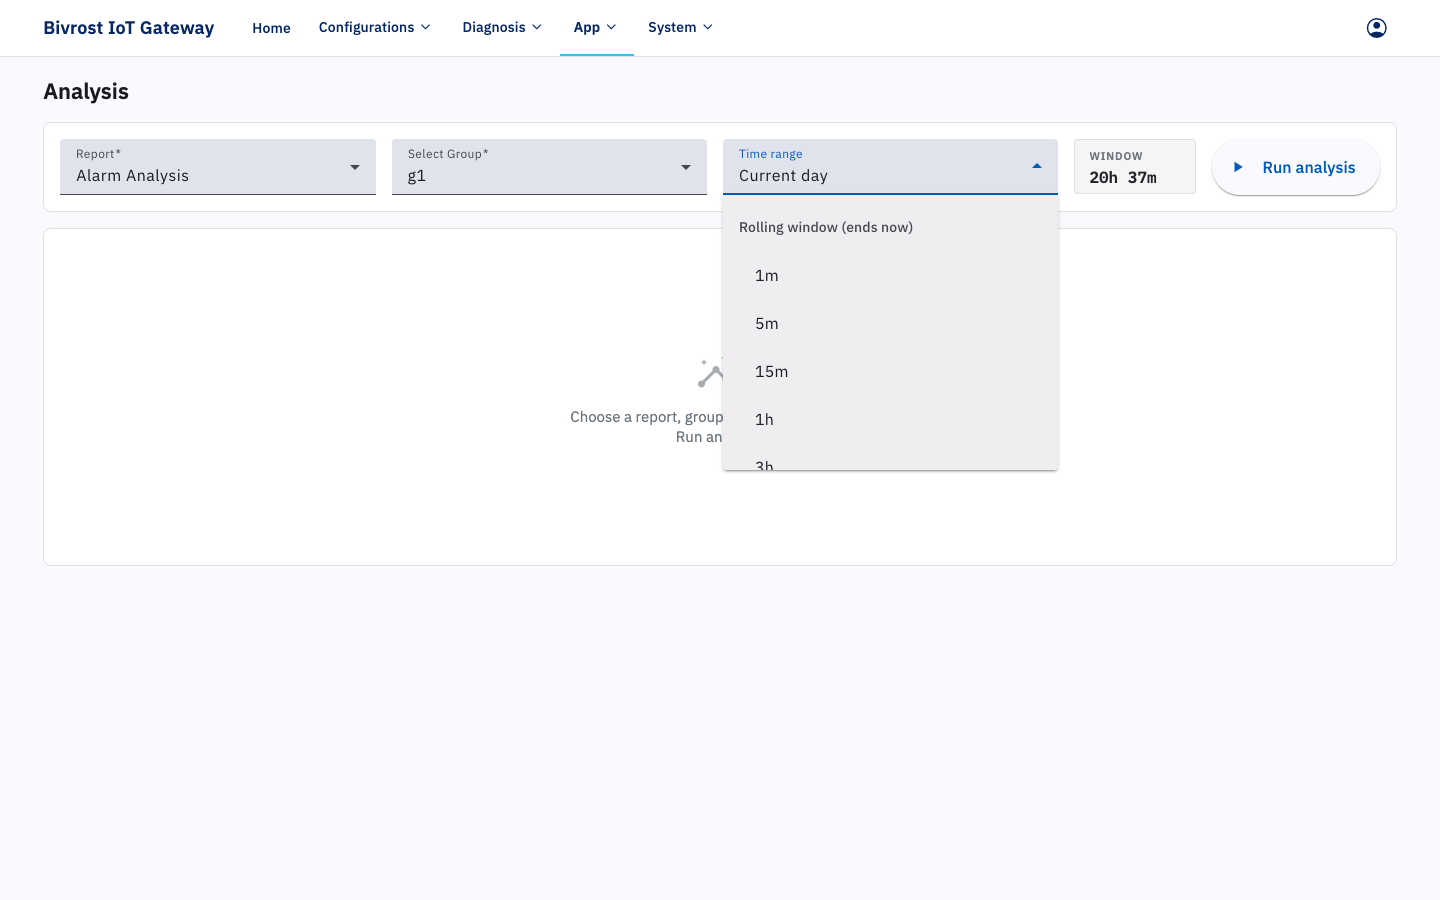
Calendar periods: options relative to the present moment, such as Current day, Current week, This day last week and Current month. Current week, for example, sets the start time to midnight on Monday of the current week.
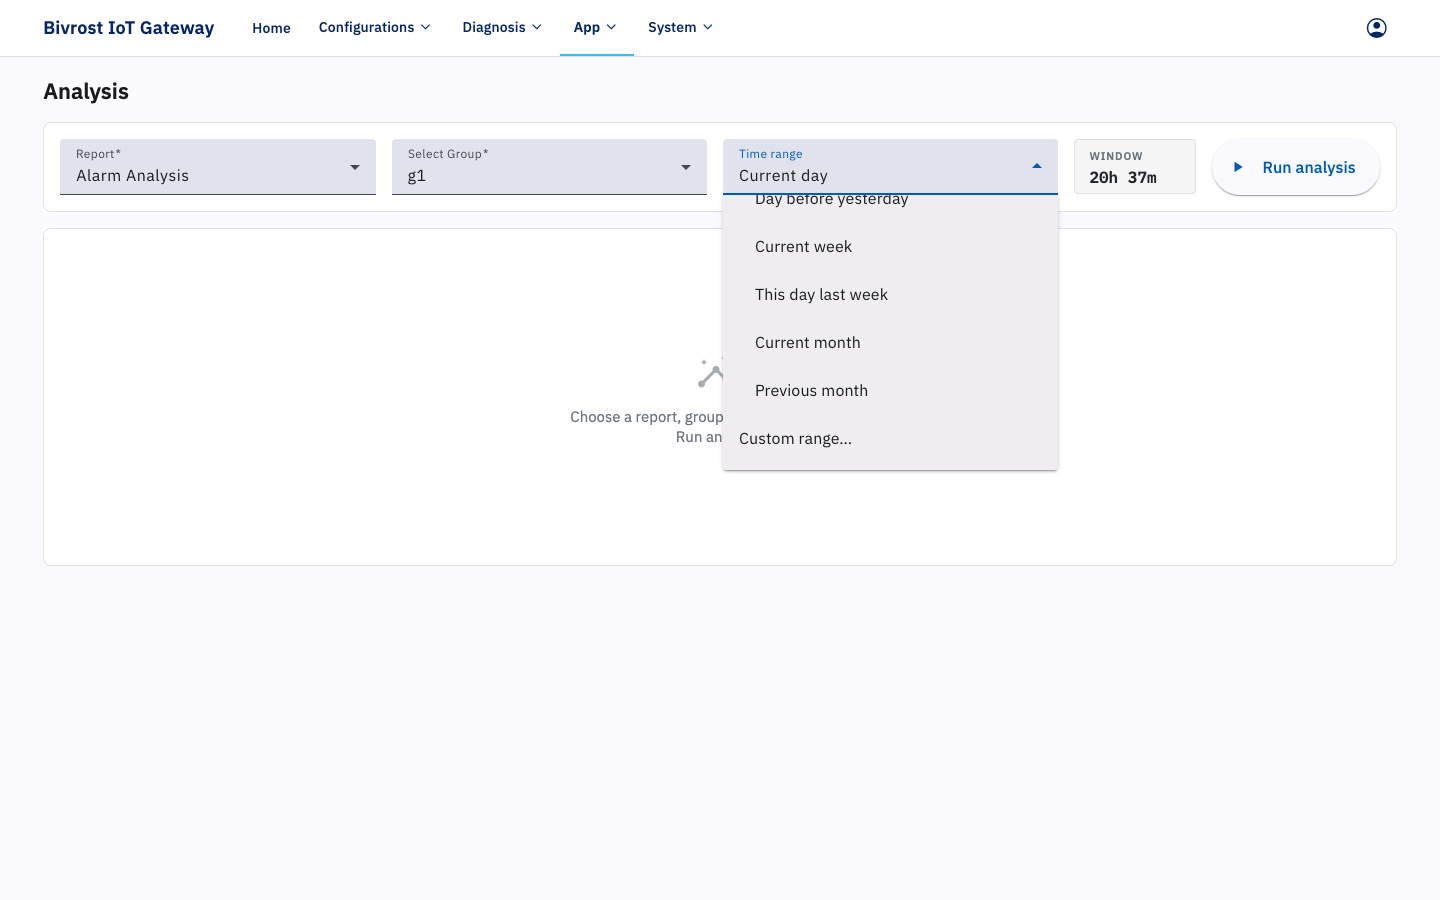
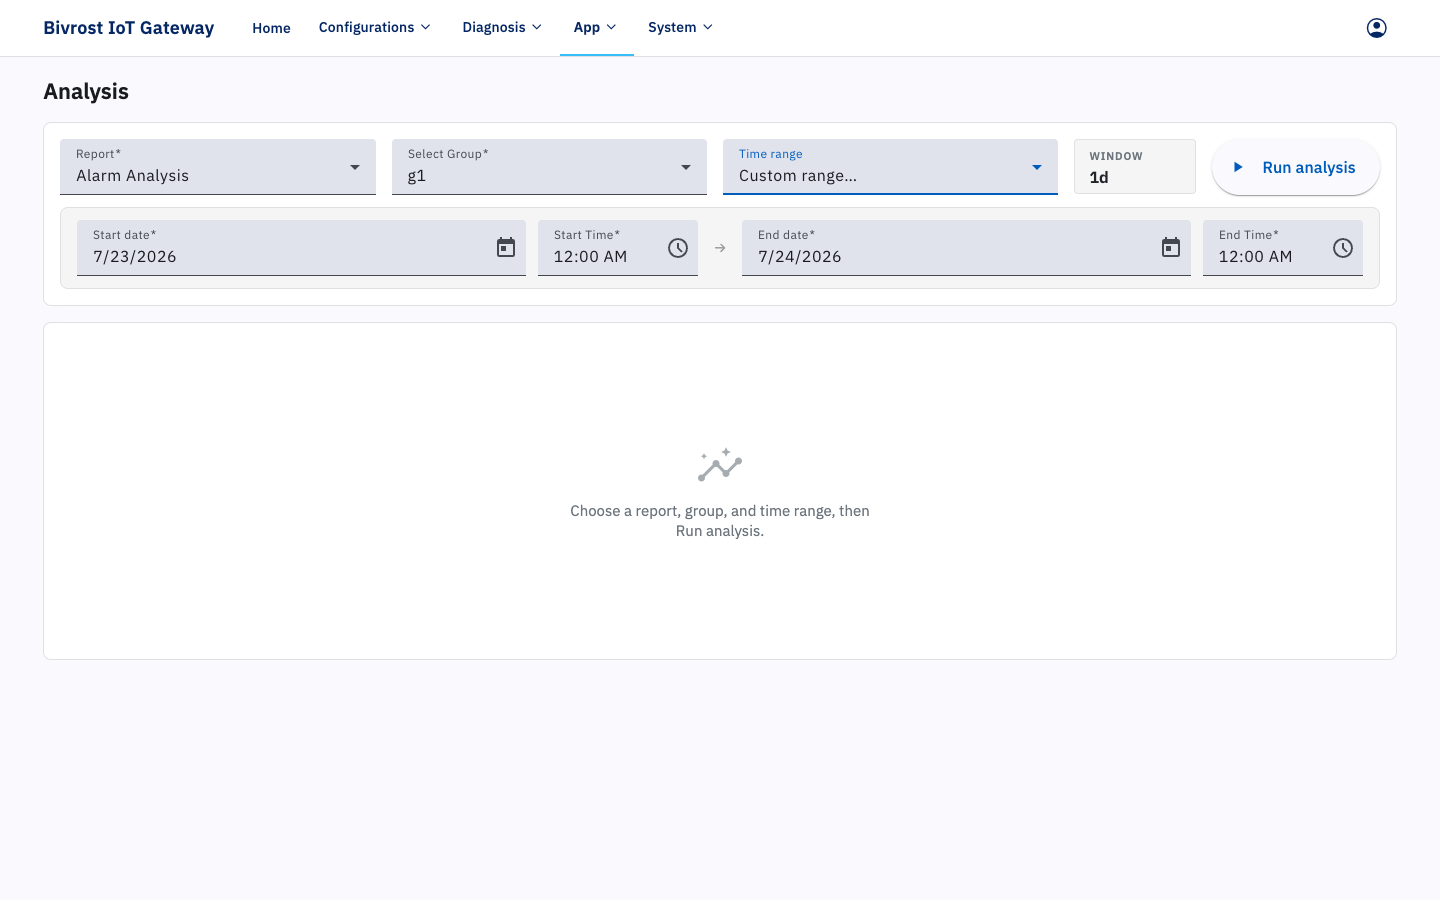
Custom range…: enter the exact start and end date and time by hand.
The options specific to each analyzer, and the results they produce, are described below.
3.10.1. Alarm Analysis
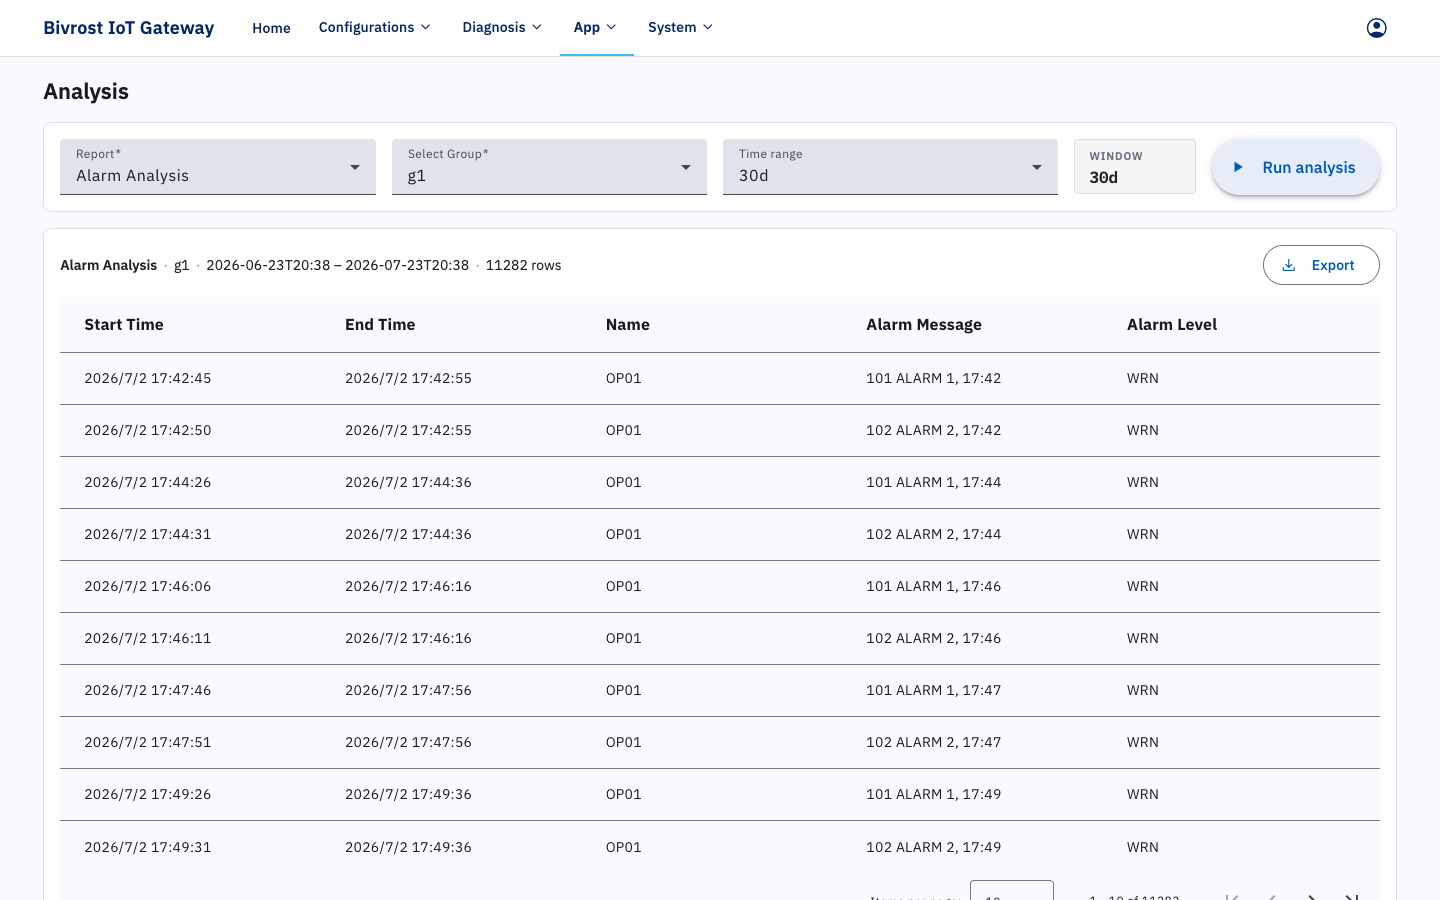
Section titled “3.10.1. Alarm Analysis”The figure below shows the alarm analysis table for every machine in the selected group, produced by choosing Alarm Analysis, Group 1 and the last 30 days and clicking Run analysis. It lists the start and end time of each alarm, its message and its level.
Once the result has been calculated, click Export to download it as a CSV file. The file is named automatically as AnalyzerName-GroupName-StartTime-EndTime.csv.
3.10.2. Count Analysis
Section titled “3.10.2. Count Analysis”The figure below shows the count analysis table for every machine in the selected group, produced by choosing Count Analysis, Group 1 and the last 30 days and clicking Run analysis. Count here means the count produced within the specified time range.
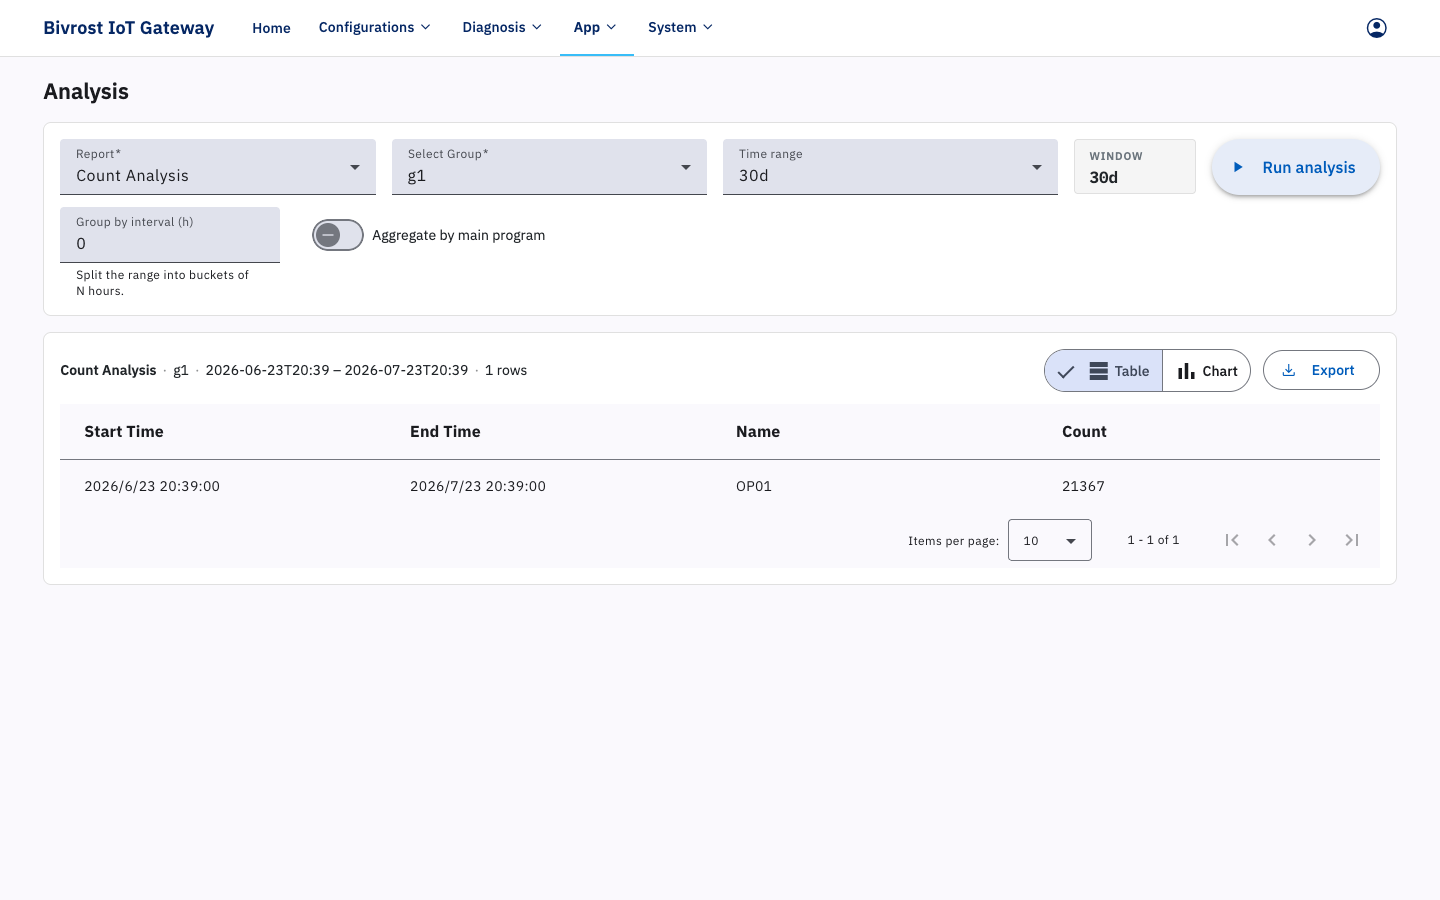
Three settings are specific to this analyzer: Group by interval (h), Aggregate by main program and Group total by count multiplier.
Group by interval (h) splits the time range into buckets: starting from the start time, each interval forms one bucket, and the count is calculated separately for each bucket. The default is 0, which means no grouping — a single bucket. The example below uses a grouping interval of 24 hours, so the count shown is the count within each interval.
Aggregate by main program breaks the count within each bucket down by the main program that was running at the time. In the figure below, mock machine 1 runs two different main programs, so the count is reported separately for each of them.
Group total by count multiplier outputs a single group row per bucket: the sum of each machine’s count × that machine’s count multiplier, the same calculation the group count monitor uses. Count multipliers are set in 3.4.1.1. Group General Settings. It is exclusive with Aggregate by main program — turning one on turns the other off.
Once the result has been calculated, click Export to download it as a CSV file. The file is named automatically as AnalyzerName-GroupName-StartTime-EndTime.csv.
3.10.3. Cycle Analysis
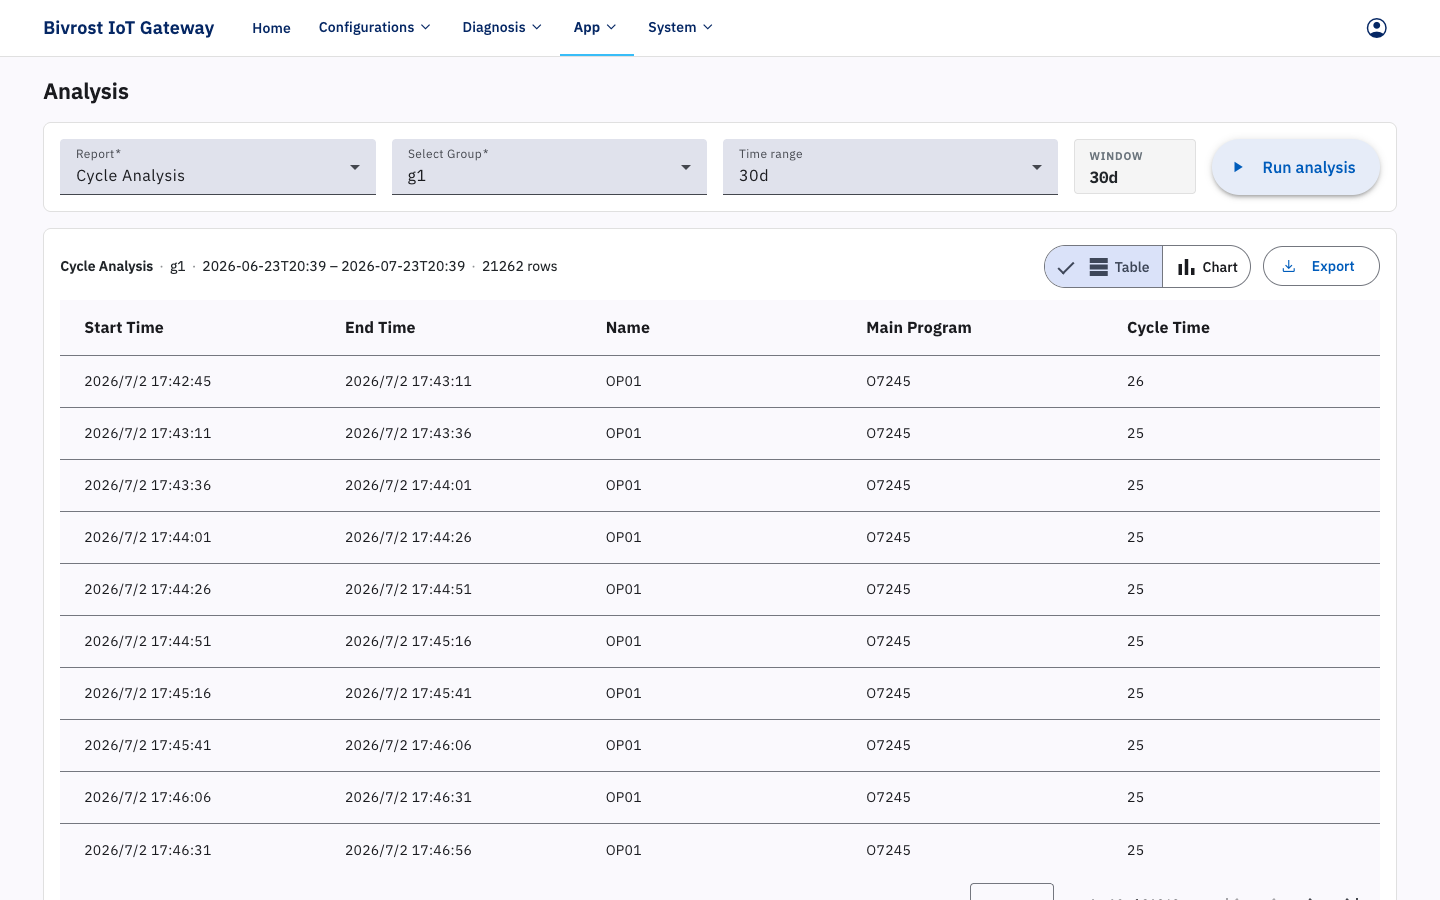
Section titled “3.10.3. Cycle Analysis”The figure below shows the cycle analysis table for every machine, produced by choosing Cycle Analysis, Group 1 and the last 30 days and clicking Run analysis. It shows, for each machine within the period, the start and end time of every cycle, the main program that was running, and the cycle time.
Once the result has been calculated, click Export to download it as a CSV file. The file is named automatically as AnalyzerName-GroupName-StartTime-EndTime.csv.
3.10.4. OEE Analysis
Section titled “3.10.4. OEE Analysis”The figure below shows the OEE analysis table for every machine, produced by choosing OEE Analysis and Group 1, entering an explicit start and end time, setting a grouping interval and clicking Run analysis.
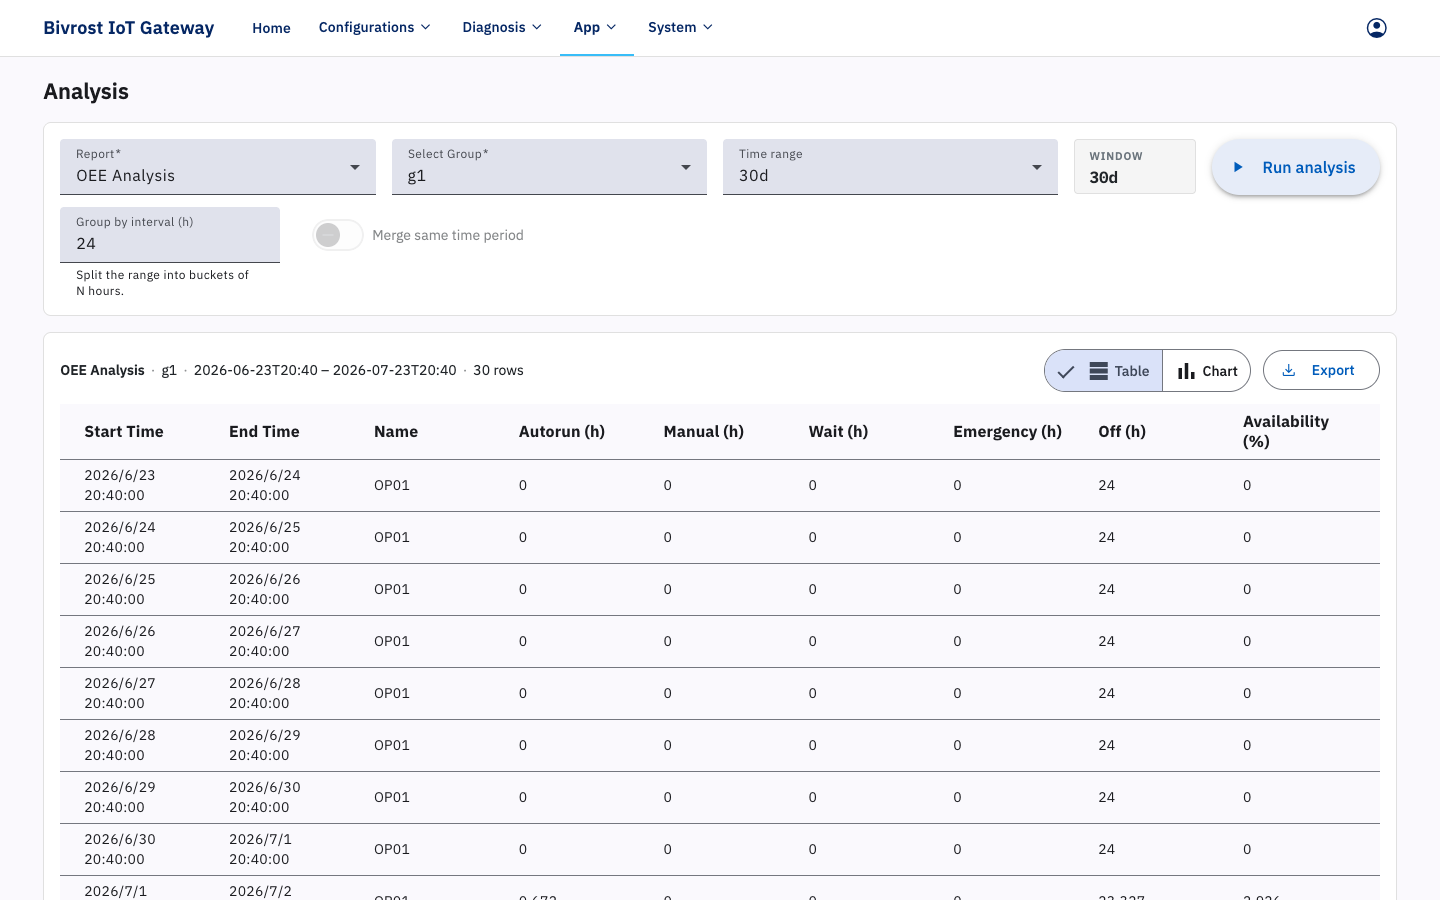
Two settings are specific to this analyzer:
Group by interval (h) works exactly as in Cycle Analysis: it splits the time range into buckets, starting from the start time, and calculates OEE separately for each bucket. The default is 0, which means no grouping — a single bucket.
Merge same time period aggregates the OEE data of the buckets that cover the same period of each day. It is typically used to compile OEE data for the several shifts worked each day. You must therefore set the start time to the time a shift begins and set the grouping interval to the length of one shift (greater than 0 and less than 24 hours); only then do you get an OEE summary that matches the shifts. The figure below summarises OEE for two shifts per day (day shift 8:00-20:00, night shift 20:00-8:00) over the specified time range.
Once the result has been calculated, click Export to download it as a CSV file. The file is named automatically as AnalyzerName-GroupName-StartTime-EndTime.csv.
3.10.5. Overall Analysis
Section titled “3.10.5. Overall Analysis”Overall Analysis combines Count Analysis and OEE Analysis.
The figure below shows the OEE data and count data for two shifts per day (day shift 8:00-20:00, night shift 20:00-8:00) over the specified time range.
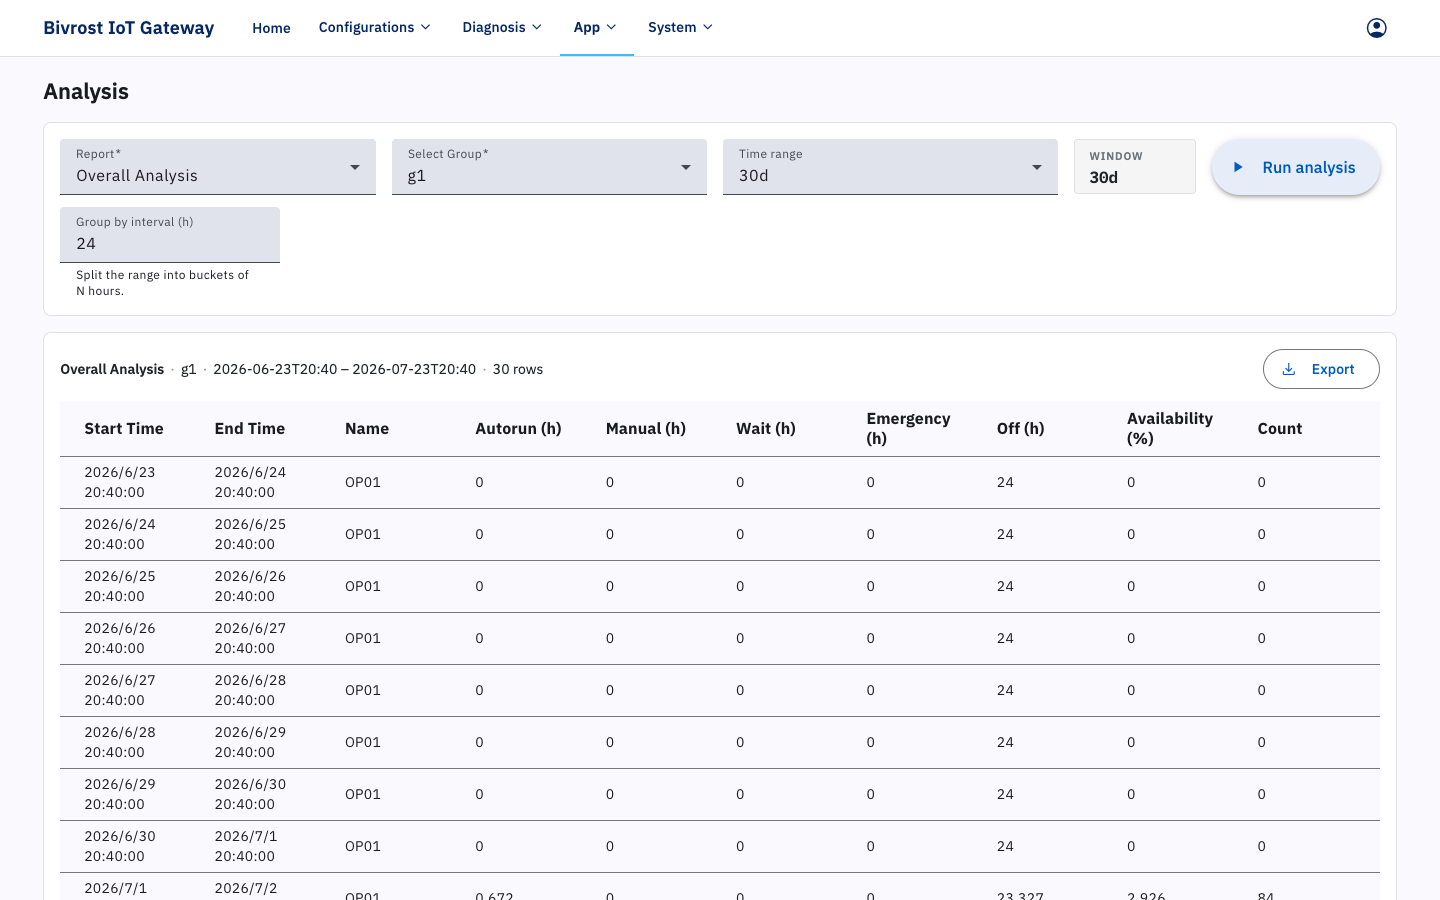
Once the result has been calculated, click Export to download it as a CSV file. The file is named automatically as AnalyzerName-GroupName-StartTime-EndTime.csv.